Report on the use of passive acoustic monitoring for the North Slave Métis Alliance

Abstract
The North Slave Métis Alliance deployed Autonomous Recording Units (ARUs) across 19 locations over three years to characterize the acoustic community. This project is part of a broader community-based monitoring initiative under the NSMA Guardianship Program, which incorporates game cameras, ARUs, water quality sampling, and eDNA to assess biodiversity in the North Slave Region. A total of 81 species were detected, 4 species-at-risk, with species accumulation beginning to stabilize as more locations were surveyed. These results highlight the effectiveness of ARUs in detecting species and their potential to enhance the overall North Slave species monitoring programs. Continued long-term sampling of sites already surveyed, along with the inclusion of new locations in areas that reflect the dynamic northern landscape, is recommended to sustain and improve monitoring efforts.
Note
This report is dynamically generated, meaning its results may evolve with the addition of new data or further analyses. For the most recent updates, refer to the publication date and feel free to reach out to the authors.
Land Acknowledgement
We acknowledge the traditional lands and territories of the North Slave Métis Alliance (NSMA), whose members trace their origins to the early unions of French fur-traders and Indigenous women of the Great Slave Lake region. The Métis of this area have long existed as a distinct and vibrant community, exercising their harvesting rights across the Northwest Territories and beyond. We honour their continued stewardship of these lands and their rights recognized under section 35(1) of the Constitution Act, 1982.
Introduction
Human activities have been identified as key pressures and contributors to the global decline in forest wildlife (Allan et al. (2017)). The repercussions of habitat fragmentation (Fahrig (2003)) and loss (Hanski (2011)), climate change (Mantyka-pringle, Martin, and Rhodes (2012), Sattar et al. (2021), Abrahms et al. (2023)), and increased access to sensitive areas exert direct and indirect pressures on forest biodiversity, particularly in managed regions in Canada (Lemieux et al. (2011)). Climate change and increasing wildfire activity in the western and northern boreal have significantly impacted biodiversity and species interactions in this area. Wildfire severity, intensified by climate change, significantly influences avian communities in northern boreal regions, with increasing severity favouring generalist and fire-specialist species while reducing species richness and functional diversity in sensitive habitats such as peatlands (Knaggs et al. (2020)). Furthermore, efforts to use umbrella species, like woodland caribou, for boreal landbird conservation highlights the need for complementary conservation measures (Micheletti et al. (2023)) that work in tandem.
In 2022, the North Slave Métis Alliance initiated a program incorporating autonomous recording units (ARUs) for passive acoustic monitoring of the vocalizing wildlife. ARUs are compact environmental sensors that are designed to passively record the environment (Shonfield and Bayne (2017)), capturing vocalizing species like birds and amphibians, which is growing in use across the globe (Sugai et al. (2018)). This technology enables resource managers to conduct prolonged surveys with minimal human interference. The subsequent data collected by these units contribute valuable information to metrics that can be used to study species trends over time, whereby this data aids decision-making and management within the region. Given the rapid and ease of accumulating data from these units, maintaining a high standard of data integrity is paramount to ensure future data interoperability and sharing. WildTrax is an online platform developed by the Alberta Biodiversity Monitoring Institute (ABMI) for users of environmental sensors to help addresses these big data challenges by providing solutions to standardize, harmonize, and share data.
The report summarizes the data collected from the ARUs by the NSMA from 2022 to 2025. To enhance accessibility and reproducibility, the findings will be presented in this online report with fully documented code, allowing future updates as data collection methods become standardized. Additionally, recommendations will be developed to refine data transcription priorities, improve annual reporting methods, and evaluate recommendations for long-term monitoring. The objectives of this report are to:
- Document and standardize the data management and processing procedures for acoustic data collected to ensure consistency and reproducibility.
- Provide a comprehensive report detailing all detected species and the abundance of individuals within the surveyed area.
- Facilitate the publication of data, making it accessible to the community, public, resource managers, academic institutions, and other relevant agencies to promote transparency and collaboration.
- Use evaluation results to establish robust metrics that can inform long-term monitoring and conservation strategies.
Methods
Data collection
Survey site selection was guided by the goal of capturing a representative sample of the region’s diverse habitats while considering logistical feasibility. In addition, NSMA member’s Traditional Knowledge of the land and historical distribution of species-at-risk was incorporated into the study design. Several NSMA members were interviewed and asked to identify areas of interest for sampling based on the following criteria:
- Current or historical presence of the target species at risk in the North Slave region;
- Locations of importance to traditional harvesting of NSMA membership, and,
- Locations where multiple species, species-at-risk (SAR) or non-SAR, are present
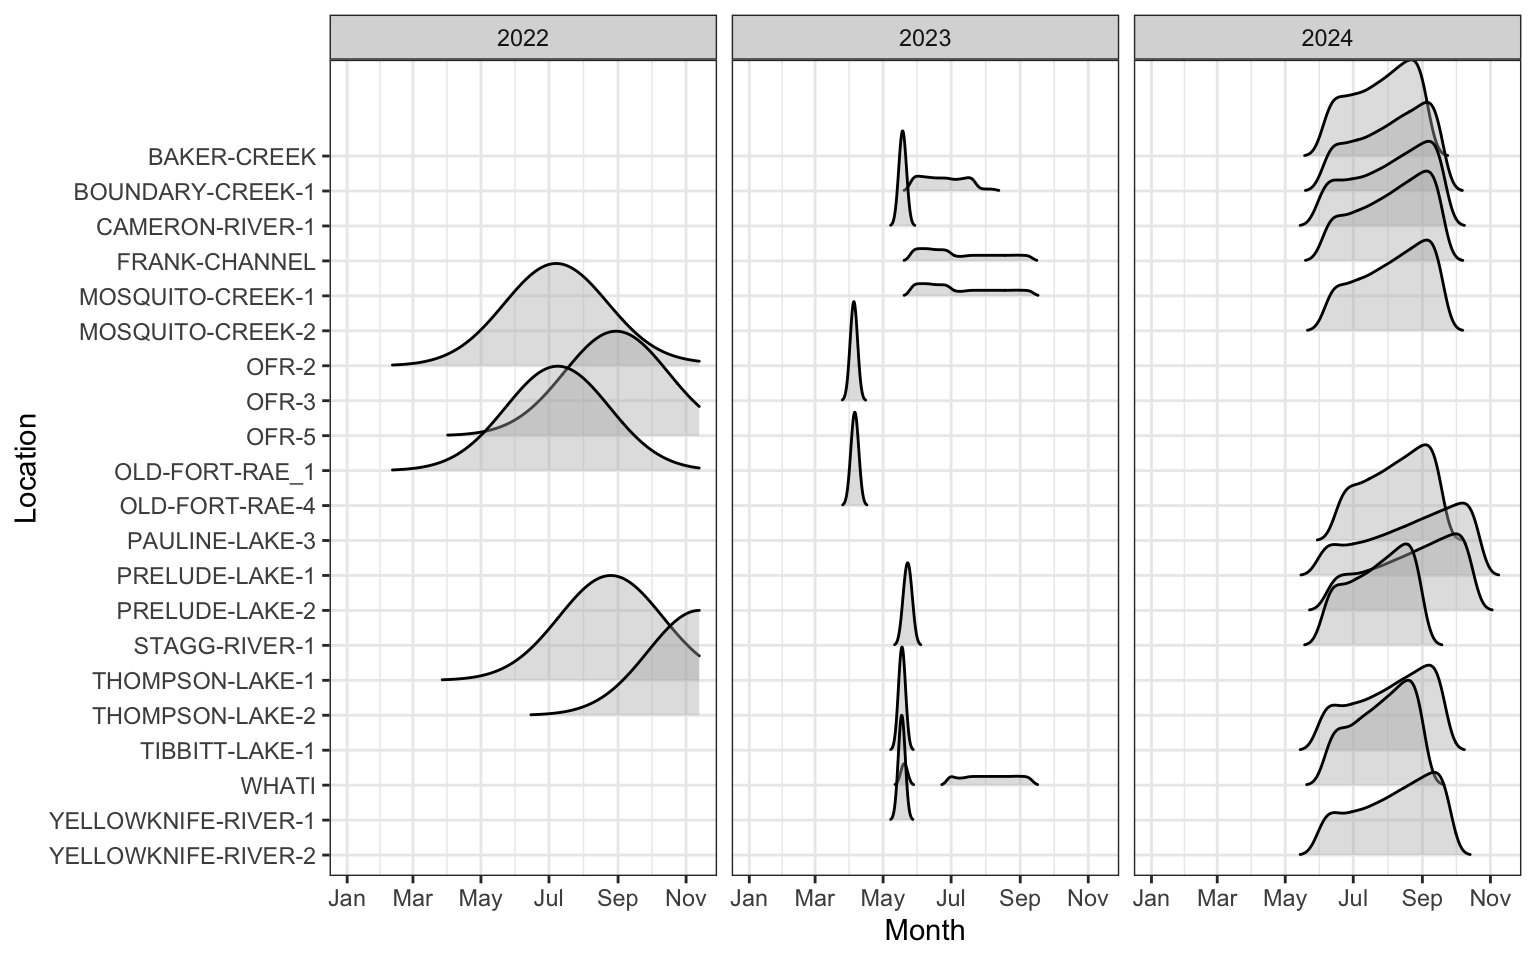
Locations were all located within the Taiga Shield Ecozone, encompassing a heterogeneous landscape of upland forests, wetlands, peatlands, and freshwater systems. Sampling locations were strategically distributed to maximize coverage across these habitat types while also sampling areas of importance to NSMA members. Detailed coordinates and descriptions of the sampling locations are provided in Table 1. ARUs were deployed over 4 consecutive years (2022, 2023, 2024, 2025); in 2022, two locations were surveyed at Old Fort Rae (62.65084, -115.8187; 62.64749, -115.8198). The survey expanded in 2023 to include eight locations spanning a larger geographic area, from Whatì (63.10753, -116.9763) to Tibbitt Lake (62.5474, -113.3551). In 2024, four additional sites were added to the original eight, increasing the total to twelve locations and enhancing spatial coverage. Finally, additional sites at Tartan Rapids and Prelude Lake were surveyed in 2025. ARUs were deployed at each site to continuously record the soundscape, allowing for the analysis of acoustic activity patterns and species presence across the study area. Data collection was improved over time, with more consistent and even data collection conducted in 2024 and 2025 as seen in Figure 2. A total of 45549 recordings were collected across all years accounting for 4832.74 audio hours of data.
Data processing
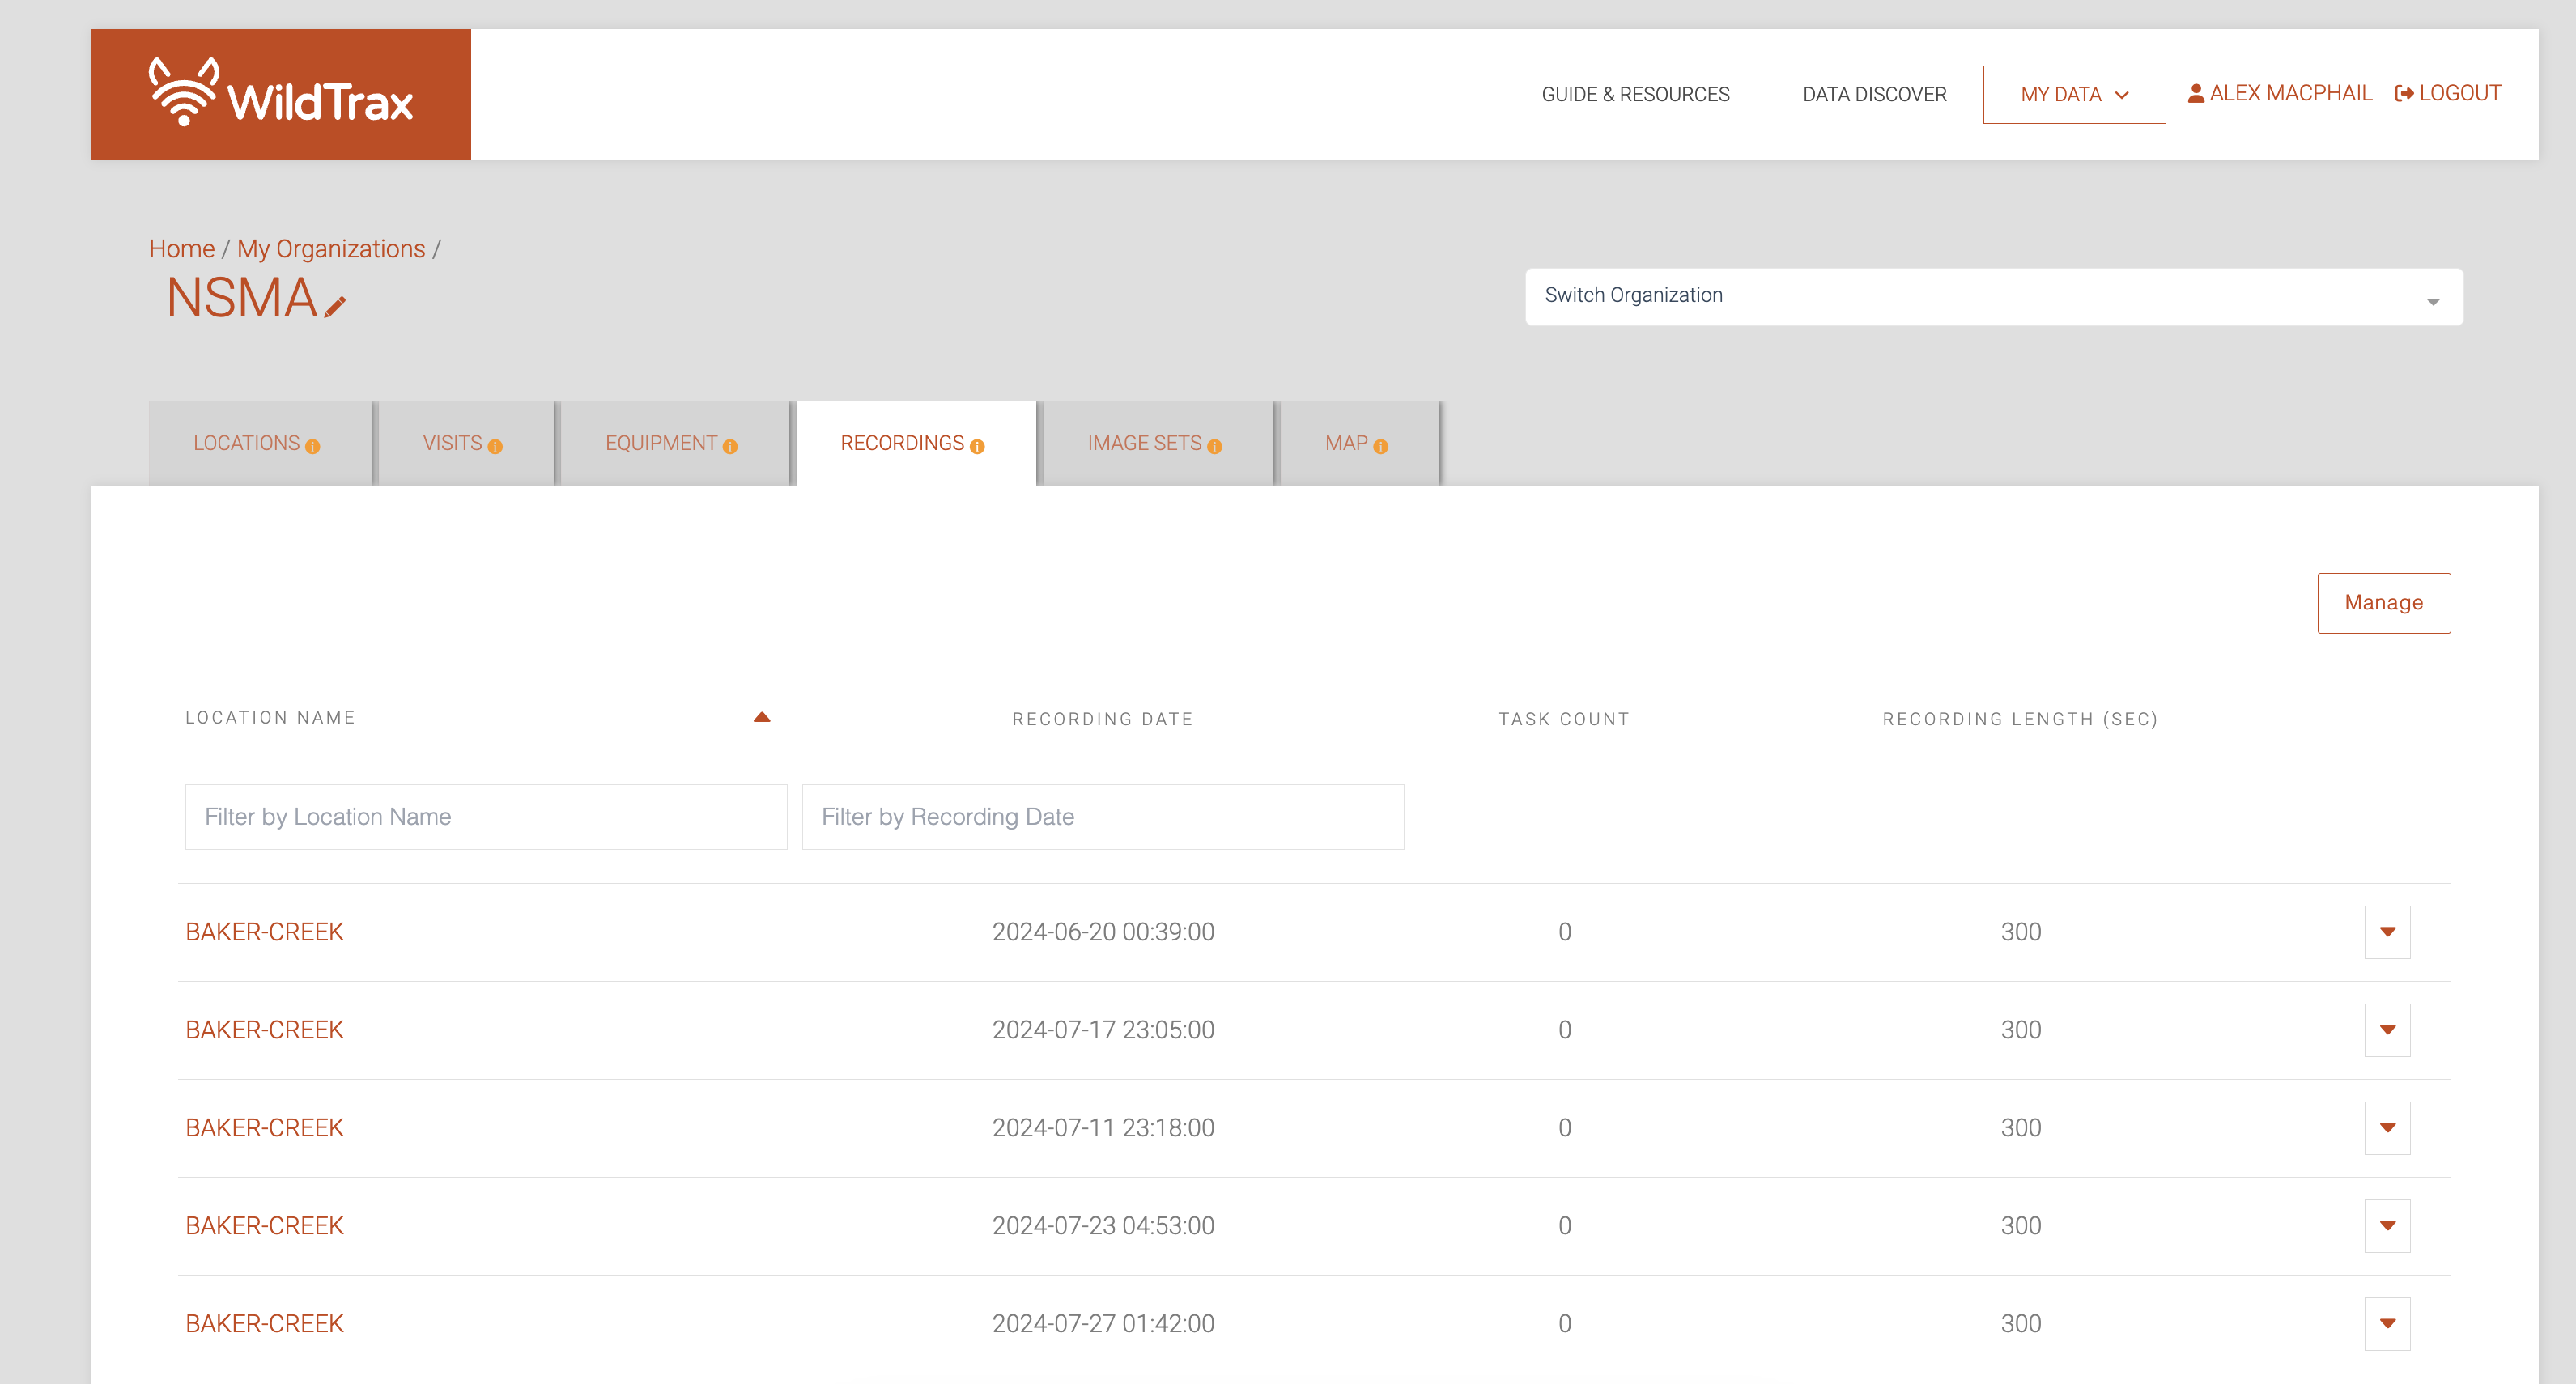
Media were transferred via hard drive to the University of Alberta in Edmonton, where they are redundantly stored on a server known as Cirrus. The recordings were standardized to ensure adherence to the naming convention of LOCATION_DATETIME, such as PREDULE-LAKE-1_20230625_053500.wav. Recordings were also directly uploaded to WildTrax for processing and can be downloaded from the platform’s Recording tab, accessible under Manage > Download list of recordings (see Figure 3).
Note
Advanced users can also use wildrtrax with wt_get_sync(api = "organization_recording_summary", option = "data", organization = 5425). Ensure you have correct access to the Organization as these projects are not currently published 2026-04-20.
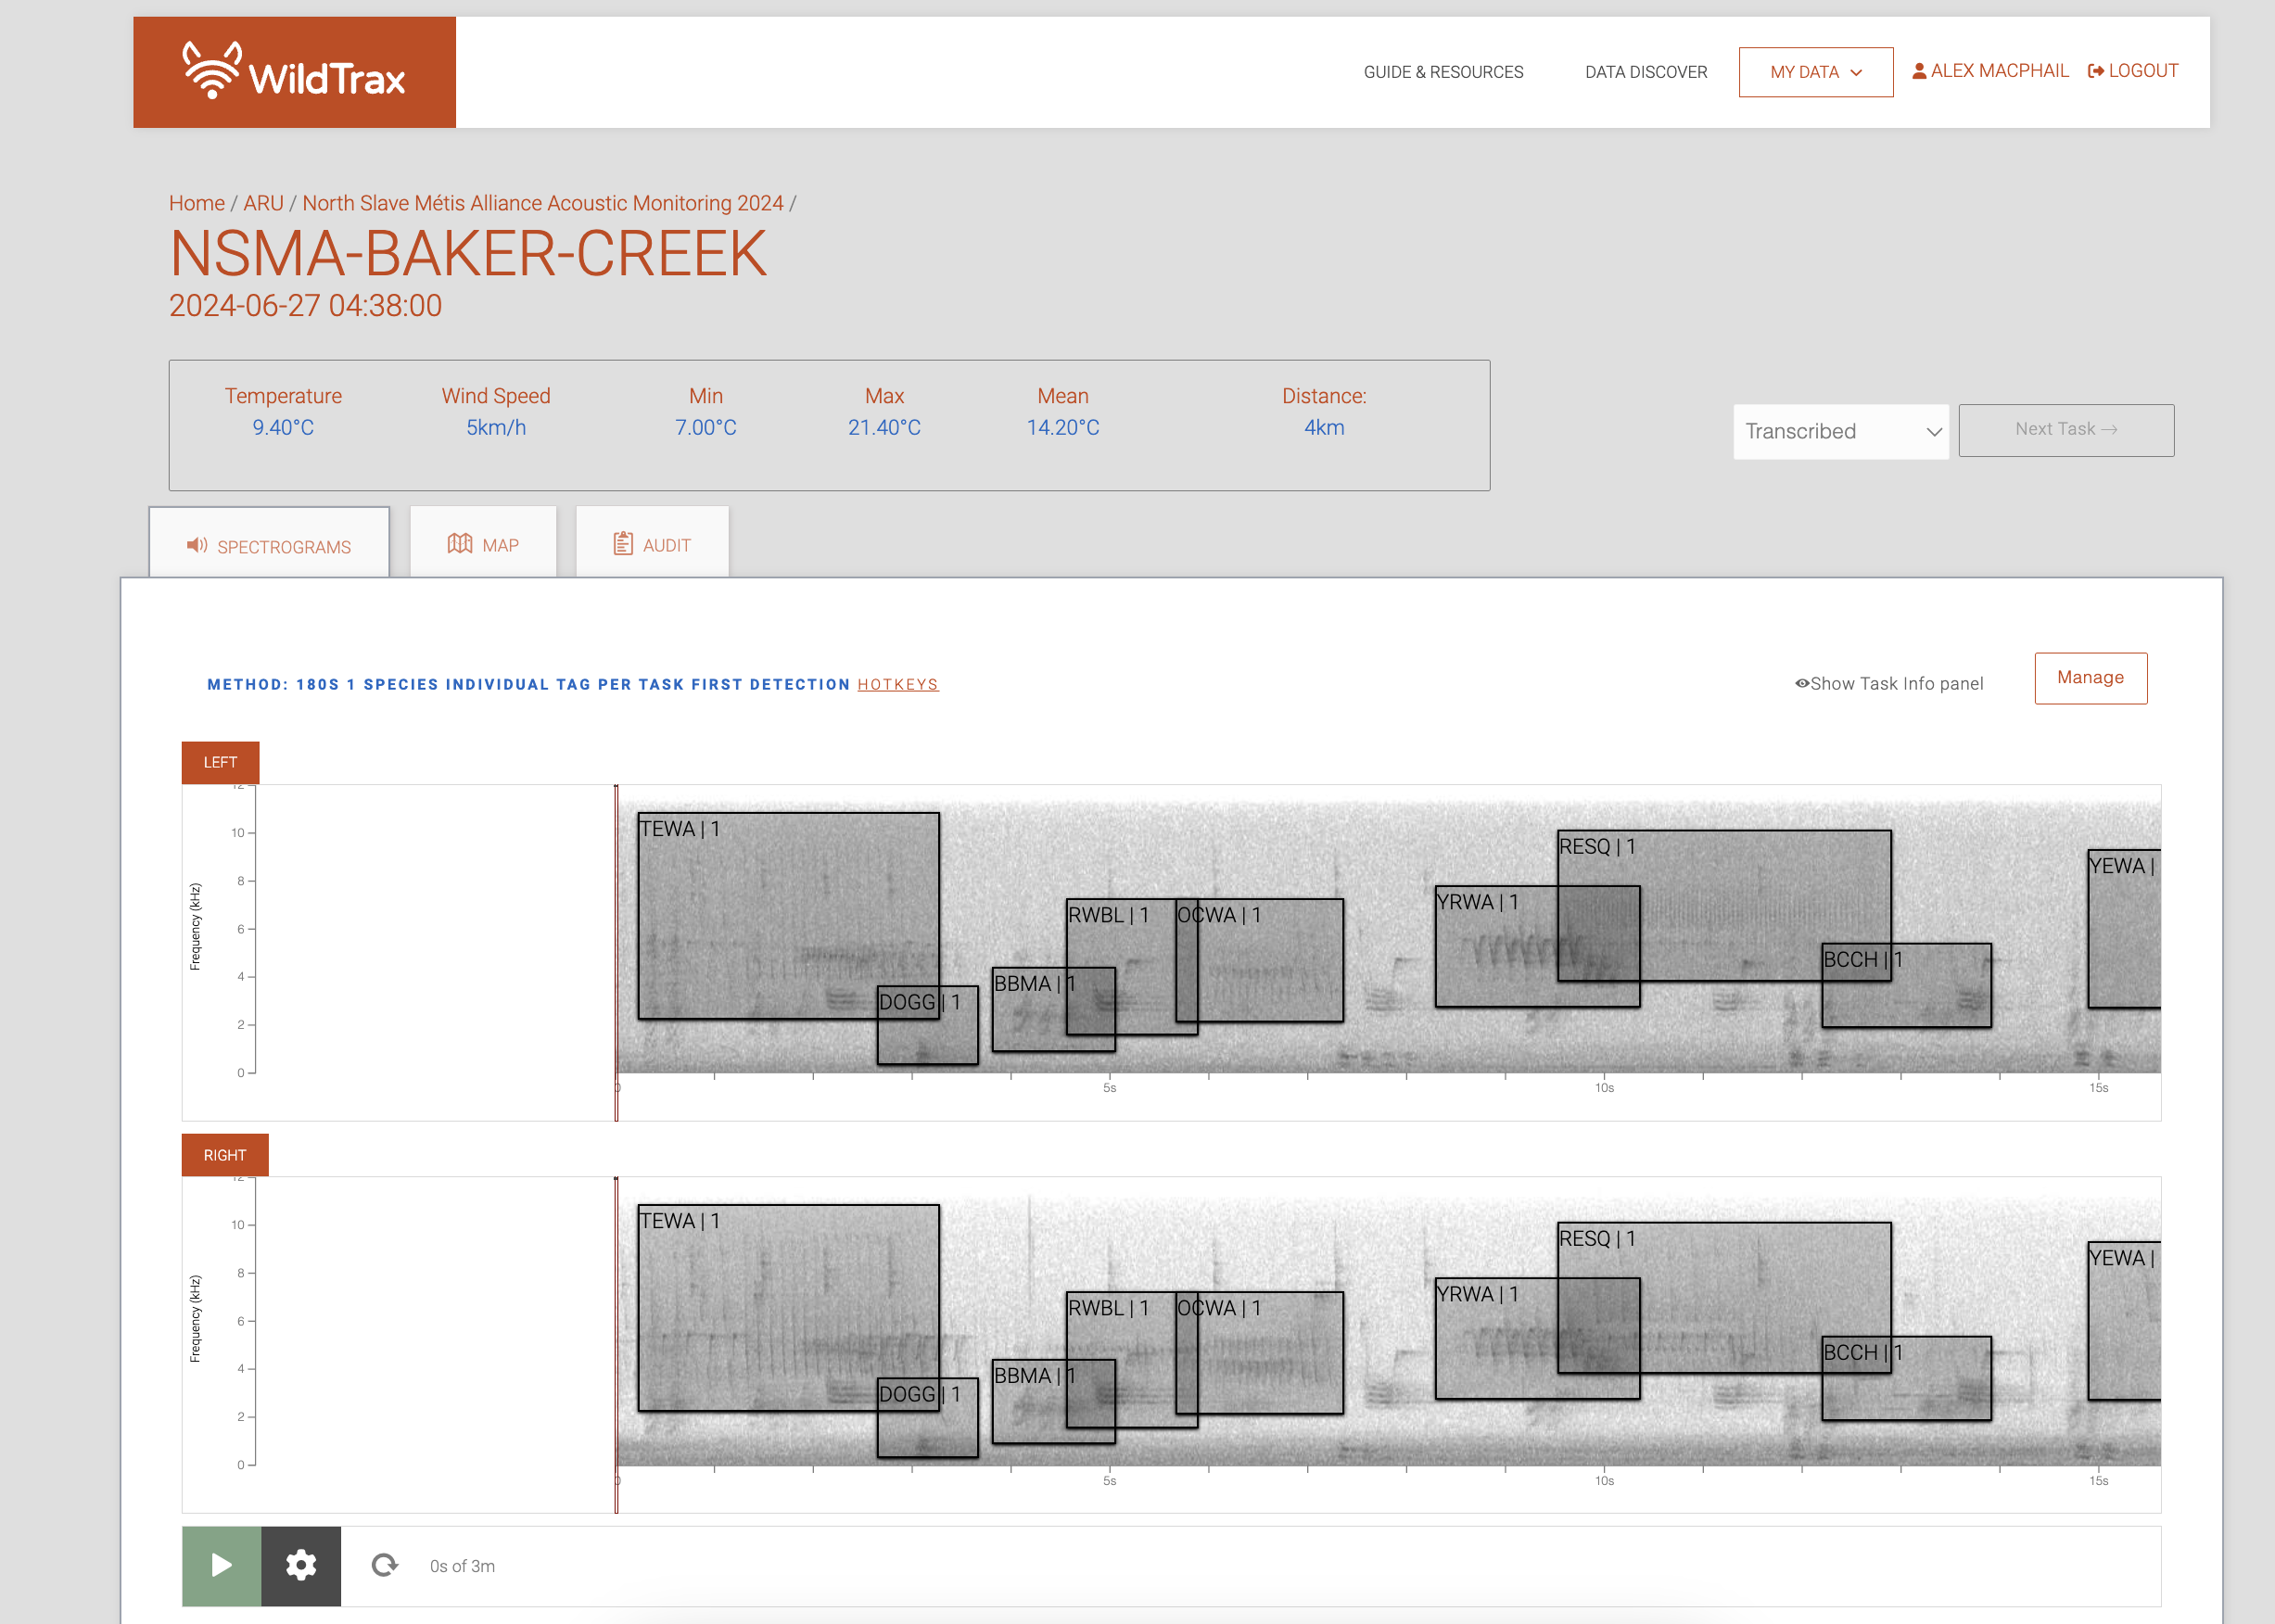
The principal goal for data processing was to describe the acoustic community of species heard at locations while choosing a large enough subset of recordings for analyses. To ensure balanced replication, for each location and year surveyed, four randomly selected recordings were processed for 3-minutes between the hours of 3:00 AM - 7:59 AM (dawn period) and 20:00 - 23:59 PM (dusk period), ideally on four separate dates. Four samples ensures that there is minimum number of samples being able to detect most species. Tags are made using count-removal (see Farnsworth et al. (2002), Sólymos et al. (2018)) where tags are only made at the time of first detection of each individual heard on the recordings. We also verified that all tags that were created were checked by a second observer (n = 3.38) to ensure accuracy of detections (see Table 2). Amphibian abundance was estimated at the time of first detection using the North American Amphibian Monitoring Program with abundance of species being estimated on the scale of “calling intensity index” (CI) of 1 - 3. Mammals such as Red Squirrel, were also noted on the recordings. After the data are processed in WildTrax, the wildrtrax package is used to download the data into a standard format prepared for analysis. The wt_download_report function downloads the data directly to a R framework for easy manipulation (see wildrtrax APIs).
| Tag is verified | Count | Proportion |
|---|---|---|
| FALSE | 545 | 32.29 |
| TRUE | 1086 | 64.34 |
| NA | 57 | 3.38 |
Analysis
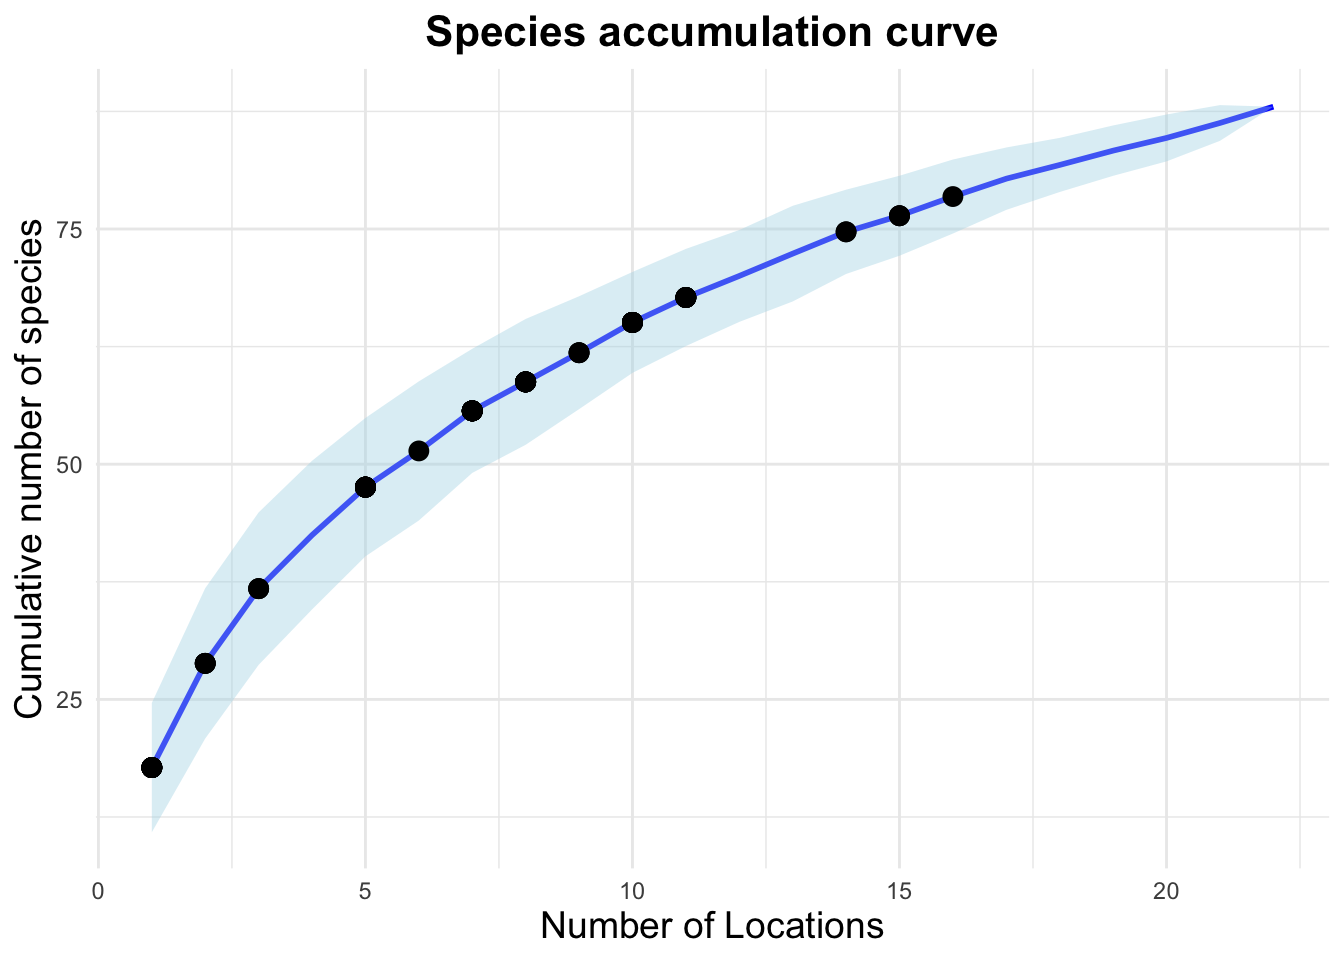
To evaluate species richness and activity patterns, we grouped the data by year and location using the dplyr R package identifying unique species detected in tasks processed within WildTrax. This enabled the creation of species richness and activity plots for the results using ggplot. We used the vegan package in R to construct a species accumulation curve, assessing the sampling effort required to capture species richness. The analysis utilized a species-by-site matrix and employed a randomized accumulation method with 100 permutations to provide robust estimates of species richness as sampling sites increased. To support site prioritization, we created a composite score through a weighted sum of three factors: the need for repeat surveys, the species richness observed at each site, and any existing project-specific priorities, here, any species-at-risk.
Results
Species accumulation
The species accumulation curve seen in Figure 6 revealed a steady increase in species richness with additional sampling sites, reaching a richness of 88 species at the maximum total of locations surveyed (n = 19). Standard deviations declined consistently with increasing sample size, reflecting greater precision in richness estimates as sampling effort increased. Richness values exhibited slightly diminishing returns beyond approximately 15 locations, indicating that additional sampling yielded fewer new species for the habitats surveyed would plateau suggests that sampling effort at this time of year was nearly sufficient to capture most vocalizing species present in the study area.
Species through the season
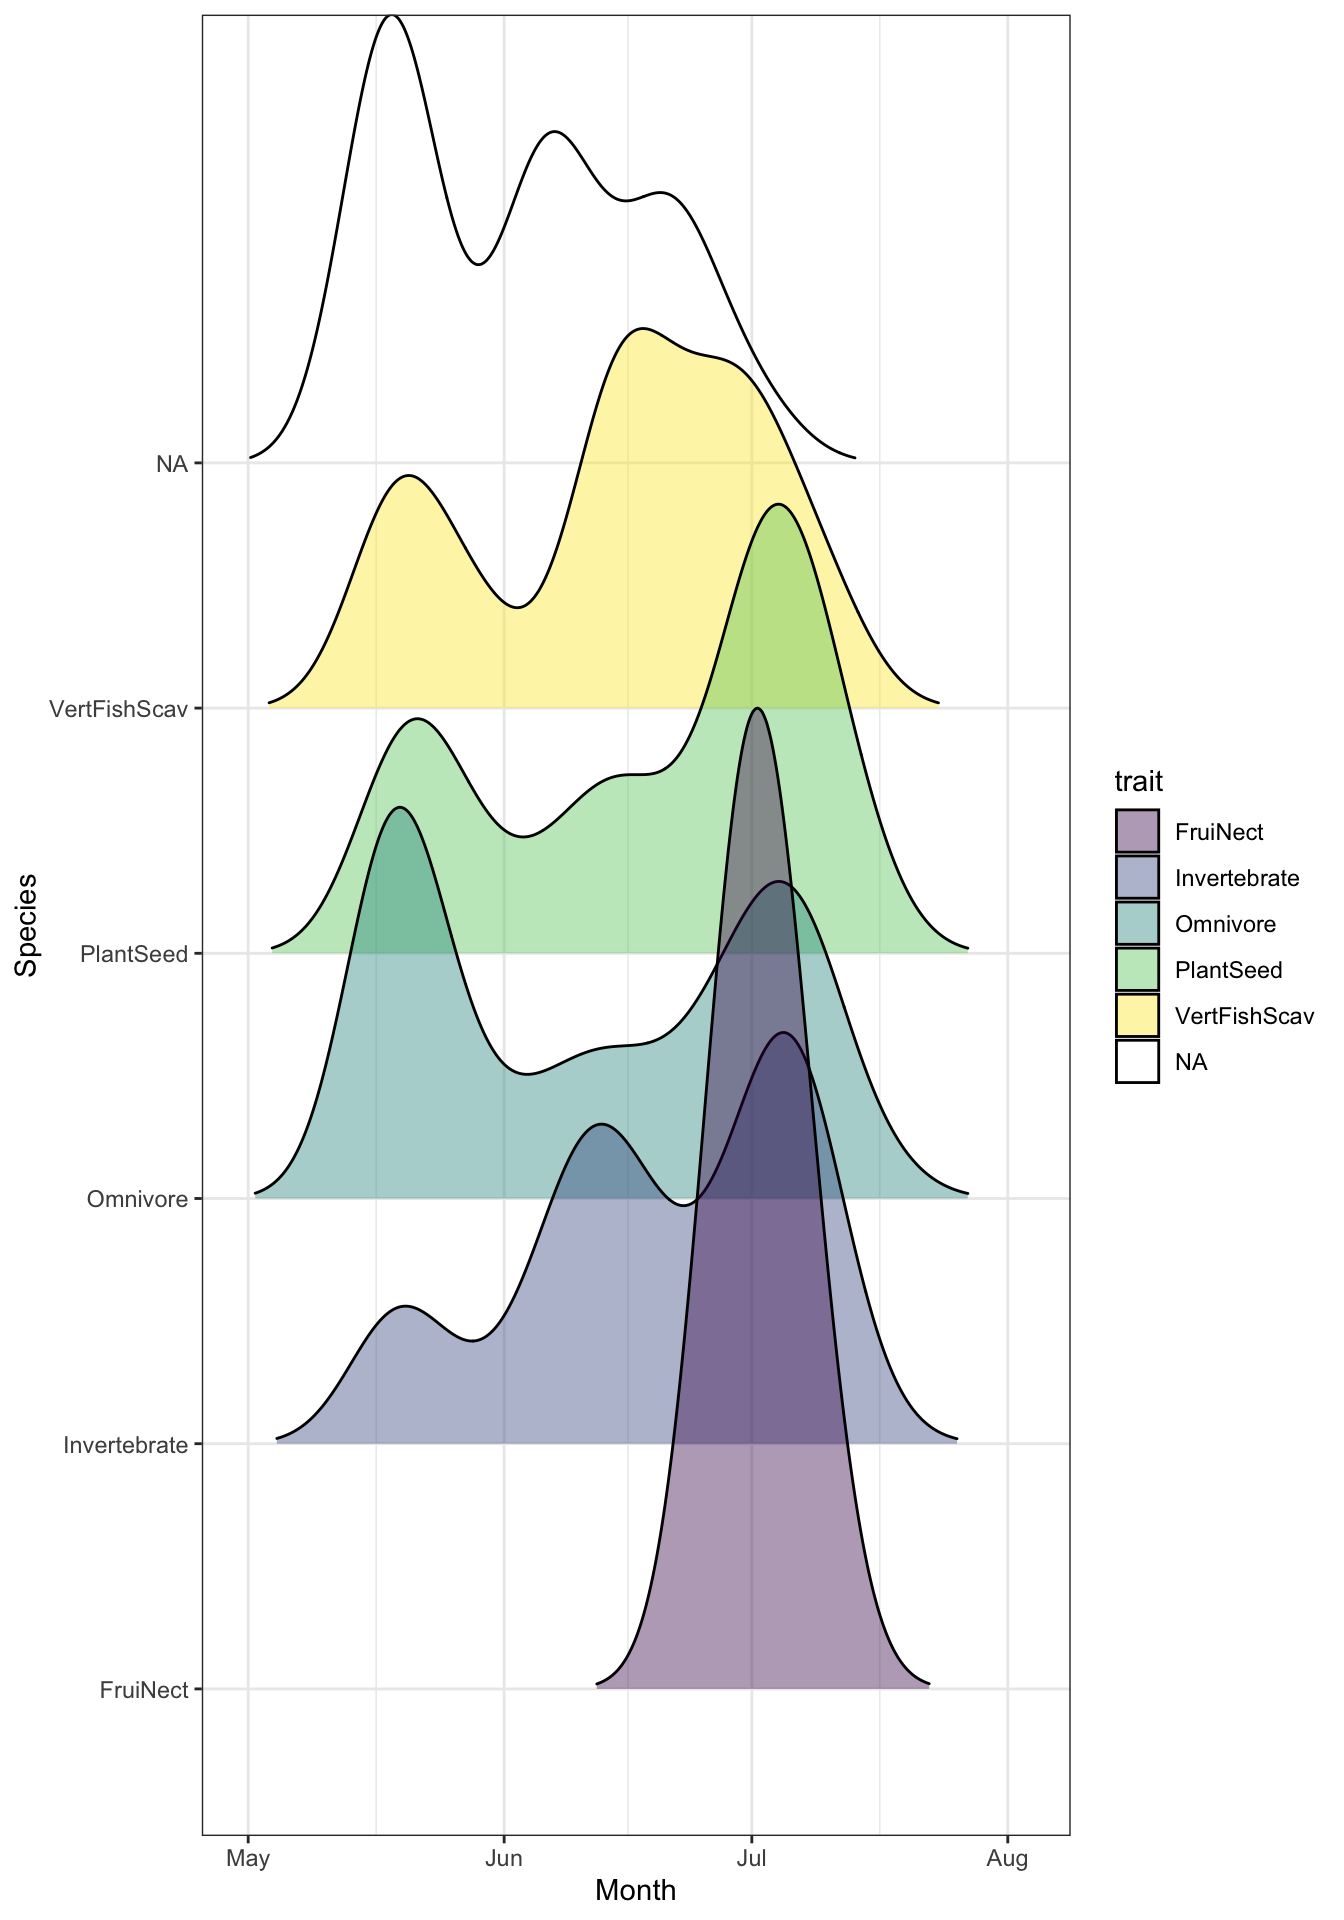
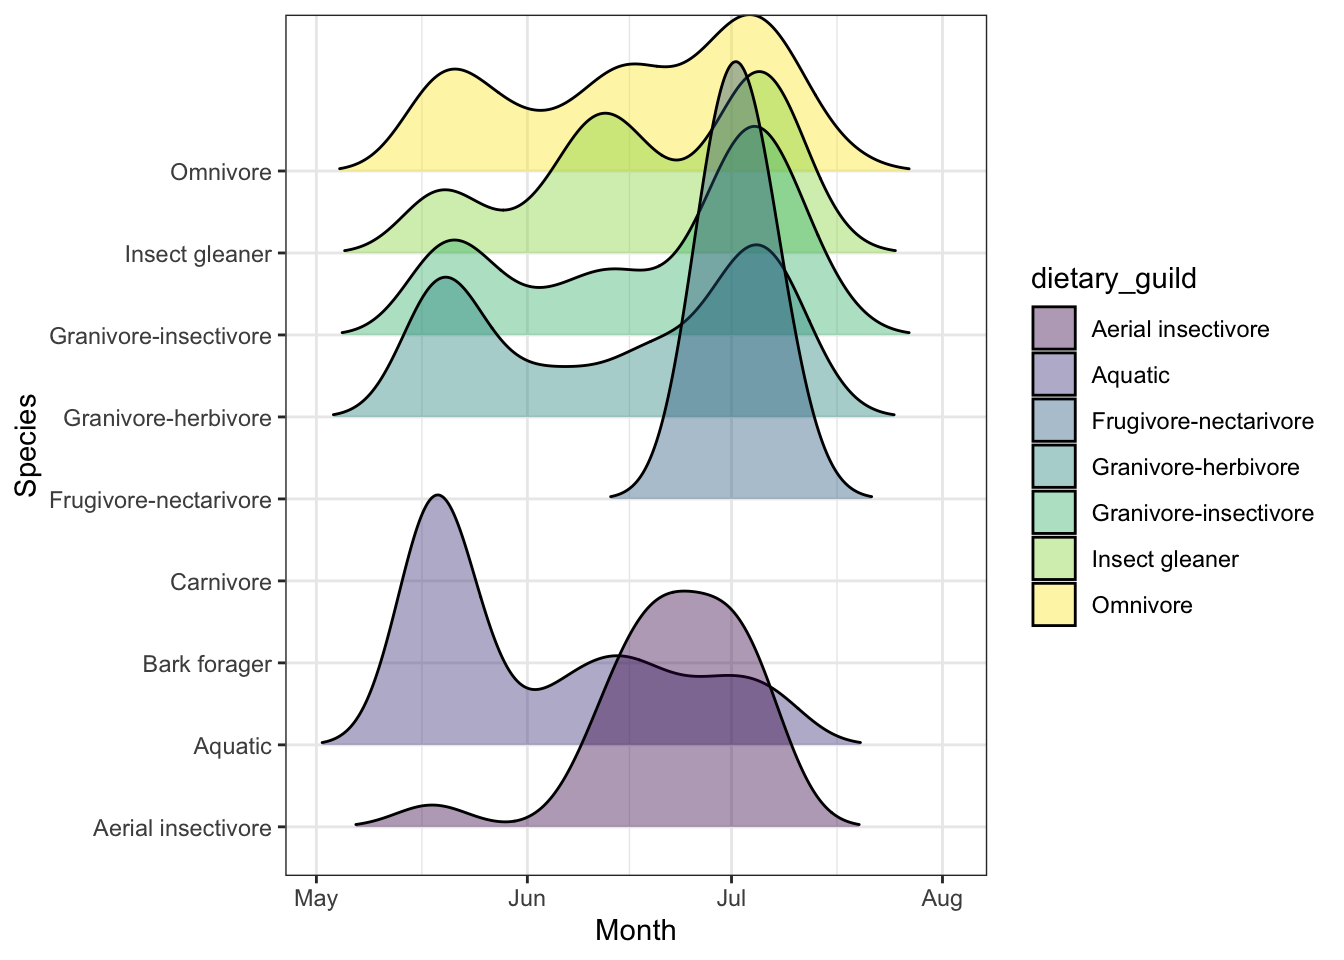
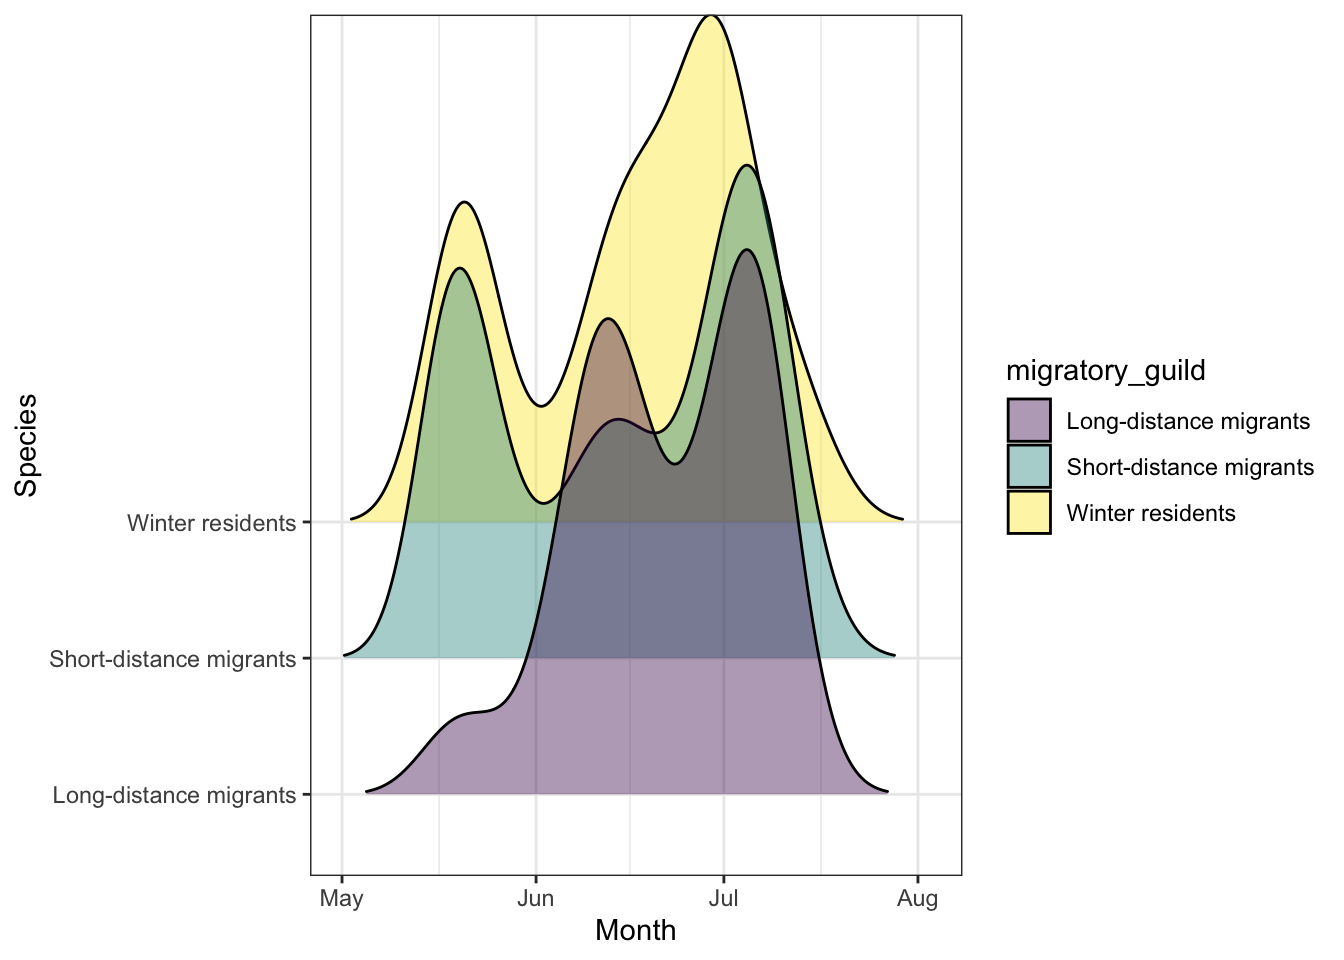
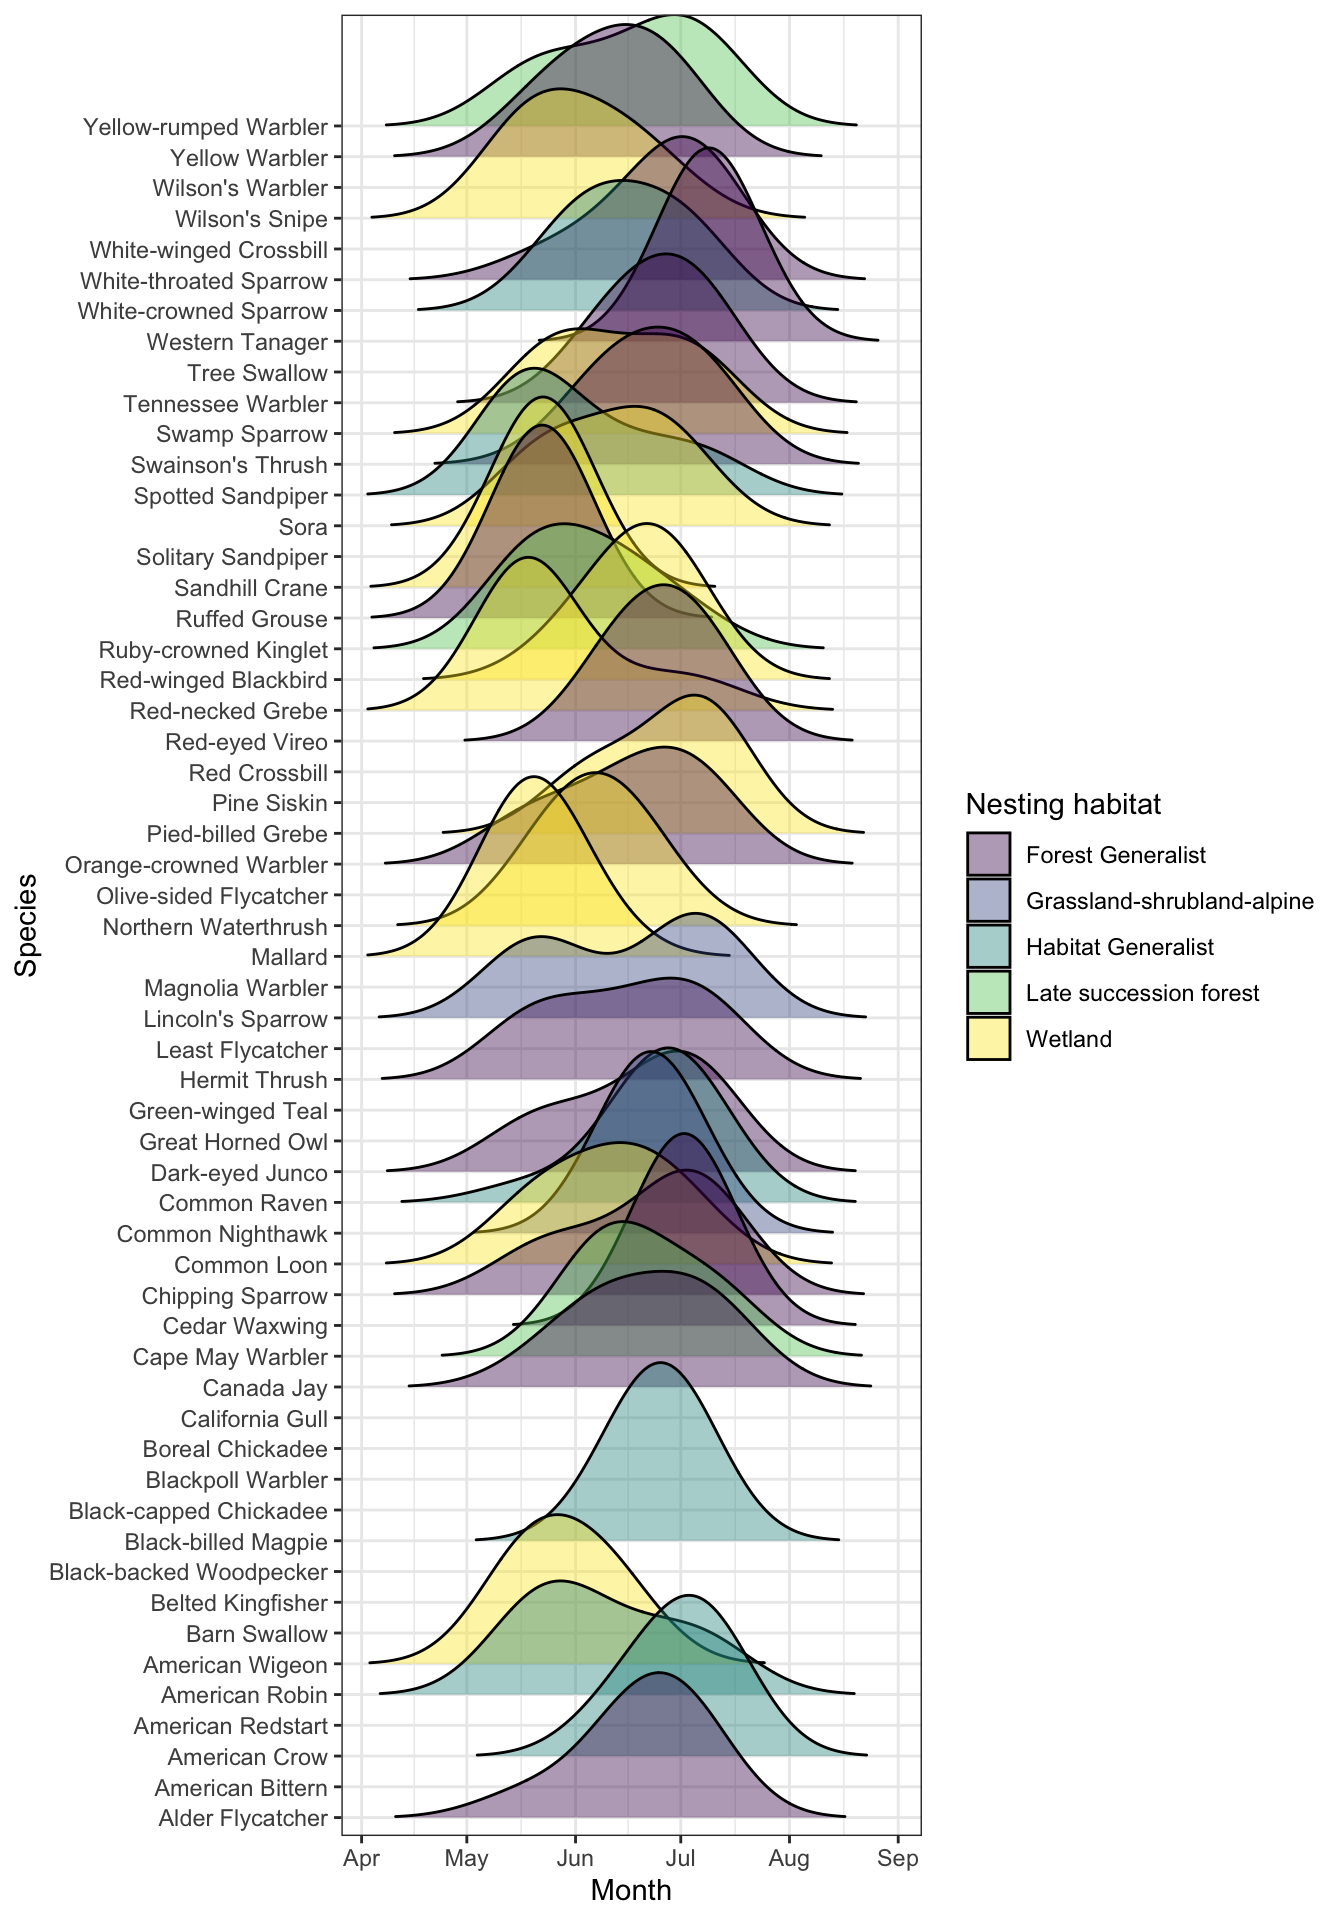
Figures Figure 7 – Figure 10 show seasonal activity patterns by nesting, trait, migratory strategy, and habitat, respectively. Any ridgeplots that aren’t shown are due to lack of data (i.e. only one or two species or guild detections) to plot the data.
Species-at-risk
4 species-at-risk were discovered in this data set. Table 4 outlines the species and which locations they were detected at. Species-at-risk status was pulled from the CANSAR database.
Discussion
To ensure the integrity and consistency of a long-term monitoring program, it is important to maintain a consistent survey schedule and timing each year when deploying ARUs. This consistency helps reduce variation caused by seasonal differences in species presence or activity. Additionally, the importance of regular maintenance and calibration of ARU equipment, particularly microphones, which degrade over time and can affect data quality if not properly managed after prolonged field use (see Turgeon, Wilgenburg, and Drake (2017)). Surveying locations with a history of monitoring over multiple years is key to tracking changes in species composition and detecting long-term trends. By including sites with both high and low species diversity, we can better understand how habitats and species ranges are shifting over time. Sites where species-at-risk are present are also prioritized to support conservation efforts. Together, these considerations inform the prioritized list of key sampling sites across the NSMA region, as summarized in Table Table 5.
As this monitoring is led by Indigenous communities, it is guided by local knowledge, values, and priorities to protect the land and wildlife. By combining new technologies and sampling technique with traditional knowledge, the program contributes to building a comprehensive, long-term understanding of biodiversity in the region. Ongoing monitoring will help track the impacts of climate change. This information will help to support communities in protecting their environment and cultural connections while strengthening resilience for the future.
References
Abrahms, Briana, Neil H Carter, TJ Clark-Wolf, Kaitlyn M Gaynor, Erik Johansson, Alex McInturff, Anna C Nisi, Kasim Rafiq, and Leigh West. 2023. “Climate Change as a Global Amplifier of Human–Wildlife Conflict.” Nature Climate Change 13 (3): 224–34.
Ackleh, Azmy S, Jacoby Carter, Lauren Cole, Tom Nguyen, Jay Monte, and Claire Pettit. 2010. “Measuring and Modeling the Seasonal Changes of an Urban Green Treefrog (Hyla Cinerea) Population.” Ecological Modelling 221 (2): 281–89.
Allan, James R, Oscar Venter, Sean Maxwell, Bastian Bertzky, Kendall Jones, Yichuan Shi, and James EM Watson. 2017. “Recent Increases in Human Pressure and Forest Loss Threaten Many Natural World Heritage Sites.” Biological Conservation 206: 47–55.
Cameron, J., A. Crosby, C. Paszkowski, and E. Bayne. 2020. “Visual Spectrogram Scanning Paired with an Observation–Confirmation Occupancy Model Improves the Efficiency and Accuracy of Bioacoustic Anuran Data.” Canadian Journal of Zoology 98 (11): 733–42. https://doi.org/10.1139/cjz-2020-0103.
Devarajan, Kadambari, Toni Lyn Morelli, and Simone Tenan. 2020. “Multi-Species Occupancy Models: Review, Roadmap, and Recommendations.” Ecography 43 (11): 1612–24.
Fahrig, Lenore. 2003. “Effects of Habitat Fragmentation on Biodiversity.” Annual Review of Ecology, Evolution, and Systematics 34 (1): 487–515.
Farnsworth, George L, Kenneth H Pollock, James D Nichols, Theodore R Simons, James E Hines, and John R Sauer. 2002. “A Removal Model for Estimating Detection Probabilities from Point-Count Surveys.” The Auk 119 (2): 414–25.
Gahbauer, Marcel A, Scott R Parker, Joanna X Wu, Cavan Harpur, Brooke L Bateman, Darroch M Whitaker, Douglas P Tate, Lotem Taylor, and Denis Lepage. 2022. “Projected Changes in Bird Assemblages Due to Climate Change in a Canadian System of Protected Areas.” Plos One 17 (1): e0262116.
Garland, Laura, Andrew Crosby, Richard Hedley, Stan Boutin, and Erin Bayne. 2020. “Acoustic Vs. Photographic Monitoring of Gray Wolves (Canis lupus): A Methodological Comparison of Two Passive Monitoring Techniques.” Canadian Journal of Zoology 98 (3): 219–28. https://doi.org/10.1139/cjz-2019-0081.
Handel, C. M., and M. N. Cady. 2004. “Alaska Landbird Monitoring Survey: Protocol for Setting up and Conducting Point Count Surveys.” Technical Report 2004-3. Alaska Science Center: U.S. Geological Survey.
Hanski, Ilkka. 2011. “Habitat Loss, the Dynamics of Biodiversity, and a Perspective on Conservation.” Ambio 40 (3): 248–55.
Knaggs, Michelle, Samuel Haché, Scott E Nielsen, Rhiannon F Pankratz, and Erin Bayne. 2020. “Avian Response to Wildfire Severity in a Northern Boreal Region.” Forests 11 (12): 1330.
Knight, Elly C, and Erin M Bayne. 2019. “Classification Threshold and Training Data Affect the Quality and Utility of Focal Species Data Processed with Automated Audio-Recognition Software.” Bioacoustics 28 (6): 539–54.
Lemieux, Christopher J, Thomas J Beechey, Daniel J Scott, and Paul A Gray. 2011. “The State of Climate Change Adaptation in Canada’s Protected Areas Sector.” The Canadian Geographer/Le Géographe Canadien 55 (3): 301–17.
Loeb, Susan C., Thomas J. Rodhouse, Laura E. Ellison, Cori L. Lausen, Jonathan D. Reichard, Kathryn M. Irvine, Thomas E. Ingersoll, et al. 2015. A Plan for the North American Bat Monitoring Program (NABat). U.S. Department of Agriculture, Forest Service, Southern Research Station. https://doi.org/10.2737/srs-gtr-208.
Loeb, Susan C., Thomas J. Rodhouse, Lee E. Ellison, et al. 2015. A Plan for the North American Bat Monitoring Program (NABat). Asheville, NC: U.S. Department of Agriculture, Forest Service, Southern Research Station. https://doi.org/10.1898/NWN21-10.
Lovett, Gary M. 2013. “When Do Peepers Peep? Climate and the Date of First Calling in the Spring Peeper (Pseudacris Crucifer) in Southeastern New York State.” Northeastern Naturalist 20 (2): 333–40.
MacKenzie, Darryl I., and Larissa L. Bailey. 2004. “Assessing the Fit of Site-Occupancy Models.” Journal of Agricultural, Biological, and Environmental Statistics 9 (3): 300–318. http://www.jstor.org/stable/1400484.
MacKenzie, Darryl I., James D. Nichols, James E. Hines, Melinda G. Knutson, and Alan B. Franklin. 2003. “ESTIMATING SITE OCCUPANCY, COLONIZATION, AND LOCAL EXTINCTION WHEN a SPECIES IS DETECTED IMPERFECTLY.” Ecology 84 (8): 2200–2207. https://doi.org/https://doi.org/10.1890/02-3090.
MacKenzie, Darryl I, James D Nichols, Gideon B Lachman, Sam Droege, J Andrew Royle, and Catherine A Langtimm. 2002. “Estimating Site Occupancy Rates When Detection Probabilities Are Less Than One.” Ecology 83 (8): 2248–55.
MacKenzie, Darryl I, James D Nichols, Mark E Seamans, and RJ Gutiérrez. 2009. “Modeling Species Occurrence Dynamics with Multiple States and Imperfect Detection.” Ecology 90 (3): 823–35.
Mantyka-pringle, Chrystal S, Tara G Martin, and Jonathan R Rhodes. 2012. “Interactions Between Climate and Habitat Loss Effects on Biodiversity: A Systematic Review and Meta-Analysis.” Global Change Biology 18 (4): 1239–52.
Micheletti, Tatiane, Samuel Haché, Diana Stralberg, Frances EC Stewart, Alex M Chubaty, Ceres Barros, Erin M Bayne, et al. 2023. “Will This Umbrella Leak? A Caribou Umbrella Index for Boreal Landbird Conservation.” Conservation Science and Practice 5 (4): e12908.
Oksanen, Jari, Frank G Blanchet, Roeland Kindt, Pierre Legendre, Peter R Minchin, Robert B O’Hara, Gavin L Simpson, et al. 2010. “Canonical Analysis of Principal Coordinates: A Useful Method of Constrained Ordination for Ecology.” Ecology 92 (3): 597–611. https://doi.org/10.1890/10-0340.1.
Petrikeev, Michael. 2019. “Forest Breeding Bird Abundance and Composition, Kluane National Park Reserve.”
Reichert, B., C. Lausen, S. Loeb, et al. 2018. A Guide to Processing Bat Acoustic Data for the North American Bat Monitoring Program (NABat). U.S. Geological Survey. https://doi.org/10.1898/NWN21-10.
Reichert, Brian, Cori Lausen, Susan Loeb, Ted Weller, Ryan Allen, Eric Britzke, Tara Hohoff, et al. 2018. “A Guide to Processing Bat Acoustic Data for the North American Bat Monitoring Program (NABat).” US Geological Survey.
Sattar, Q, ME Maqbool, R Ehsan, S Akhtar, Q Sattar, ME Maqbool, R Ehsan, and S Akhtar. 2021. “Review on Climate Change and Its Effect on Wildlife and Ecosystem.” Open J Environ Biol 6 (1): 008–14.
Shannon, Claude Elwood. 1948. “A Mathematical Theory of Communication.” The Bell System Technical Journal 27 (3): 379–423.
Shonfield, Julia, and Erin M Bayne. 2017. “Autonomous Recording Units in Avian Ecological Research: Current Use and Future Applications.” Avian Conservation & Ecology 12 (1).
Shonfield, Julia, Sarah Heemskerk, and Erin M Bayne. 2018. “Utility of Automated Species Recognition for Acoustic Monitoring of Owls.” Journal of Raptor Research 52 (1): 42–55.
Slough, B., C. Lausen, B. Paterson, et al. 2022. “New Records about the Diversity, Distribution, and Seasonal Activity Patterns by Bats in Yukon and Northwestern British Columbia.” Northwest Naturalist 103: 162–82. https://doi.org/10.1898/NWN21-10.
Slough, Brian G, Donald G Reid, Dafna S Schultz, and Maria C-Y Leung. 2023. “Little Brown Bat Activity Patterns and Conservation Implications in Agricultural Landscapes in Boreal Yukon, Canada.” Ecosphere 14 (3): e4446.
Solick, Daniel I. 2022. “Bat Acoustic Species-Pair Matrix for Western u.s./Canada.” Colorado: Vesper Bat Detection Services.
Solick, Donald I, and Robert MR Barclay. 2022. “Coat Color of Western Long-Eared Bats (Myotis Evotis) Living in Different Environments: A Test of Gloger’s Rule.” Northwestern Naturalist 103 (2): 183–89.
Sólymos, Péter, Steven M. Matsuoka, Steven G. Cumming, Diana Stralberg, Patricia Fontaine, Fiona K. A. Schmiegelow, Samantha J. Song, and Erin M. Bayne. 2018. “Evaluating time-removal models for estimating availability of boreal birds during point count surveys: Sample size requirements and model complexity.” The Condor 120 (4): 765–86. https://doi.org/10.1650/CONDOR-18-32.1.
Sonobat. n.d. “Western North America Bat Acoustic Table.” https://sonobat.com/download/Western_NA_Bat_Acoustic_Table.pdf.
Sugai, Larissa Sayuri Moreira, Thiago Sanna Freire Silva, Jr Ribeiro José Wagner, and Diego Llusia. 2018. “Terrestrial Passive Acoustic Monitoring: Review and Perspectives.” BioScience 69 (1): 15–25. https://doi.org/10.1093/biosci/biy147.
Szewczak, Joe. 2018. “Acoustic Features of Western US Bats.” Arcata, California: Humboldt State University.
Turgeon, Patrick, Steven L. Van Wilgenburg, and Kiel L. Drake. 2017. “Microphone Variability and Degradation: Implications for Monitoring Programs Employing Autonomous Recording Units.” Avian Conservation and Ecology 12. https://api.semanticscholar.org/CorpusID:89959184.
Ware, Lena, C. Lisa Mahon, Logan McLeod, and Jean-François Jetté. 2023. “Artificial Intelligence (BirdNET) Supplements Manual Methods to Maximize Bird Species Richness from Acoustic Data Sets Generated from Regional Monitoring.” Canadian Journal of Zoology 101 (12): 1031–51. https://doi.org/10.1139/cjz-2023-0044.