Report on the use of passive acoustic monitoring in Prince Edward Island National Park

Abstract
Passive acoustic monitoring has proven to be a valuable tool for monitoring vocalizing species. Environmental sensors are becoming increasingly easy to program and can autonomously generating extensive data sets of the soundscape, an invaluable resource for ecological integrity monitoring. Prince Edward Island National deployed autonomous recording units (ARUs) across 43 locations during a comprehensive 7-year survey. ARUs detected a total of 102 species including birds, amphibians and mammals. The analysis revealed that songbird species richness and diversity remained relatively stable, while single-species occupancy at individual sites exhibited diverse patterns. Common and generalist species showed consistent occupancy despite large sources of natural and anthropogenic disturbance. Ongoing monitoring and dynamic models can yield more detailed and predictive results to ensure the continued maintenance of ecological integrity in the Park.
Note
This report is dynamically generated, meaning its results may evolve with the addition of new data or further analyses. For the most recent updates, refer to the publication date and feel free to reach out to the authors.
Land Acknowledgement
In the spirit of Reconciliation, we acknowledge that the land upon which this data was gathered is unceeded Mi’kmaq territory. Epekwitk (Prince Edward Island), Mi’kma’ki, is covered by the historic Treaties of Peace and Friendship. We pay our respects to the Indigenous Mi’kmaq People who have occupied this Island for over 12,000 years; past, present and future.
Introduction
Human activities have been identified as key pressures and contributors to the global decline in forest wildlife (Allan et al. (2017)). The repercussions of habitat fragmentation (Fahrig (2003)) and loss (Hanski (2011)), climate change (Mantyka-pringle, Martin, and Rhodes (2012), Sattar et al. (2021), Abrahms et al. (2023)), and increased access to sensitive areas exert direct and indirect pressures on forest biodiversity, particularly in managed regions in Canada (Lemieux et al. (2011)).
In 2019, Prince Edward Island National Park initiated a program incorporating autonomous recording units (ARUs) for passive acoustic monitoring (PAM) of the Park’s wildlife. ARUs are compact environmental sensors that are designed to passively record the environment (Shonfield and Bayne (2017)), capturing vocalizing species like birds and amphibians, which is growing in use across the globe (Sugai et al. (2018)). This technology enables resource managers to conduct prolonged surveys with minimal human interference. The subsequent data collected by these units contribute valuable information to ecological integrity metrics such as species richness, diversity, occupancy, and trends over time. This data aids decision-making and management within the Park. Given the rapid and ease of accumulating data from these units, maintaining a high standard of data integrity is paramount to ensure future data interoperability and sharing. WildTrax is an online platform developed by the Alberta Biodiversity Monitoring Institute (ABMI) for users of environmental sensors to help addresses these big data challenges by providing solutions to standardize, harmonize, and share data.
The objectives of this report are to:
- Describe the data management and processing procedures for the acoustic data collected from 2019 to 2025;
- Utilize traditional human tagging, visual scanning and automated recognition techniques to detect and count species and individuals heard on recordings;
- Define straightforward methods for evaluating species presence, species richness, and species occupancy over time at various locations;
- Assess the potential of ARUs to detect roosting-associated Bank Swallow activity at pond sites within PEINP, including the timing, call frequency, and configuration effects across monitoring years;
- Offer recommendations for ongoing monitoring approaches, including ARU deployment configurations and scheduling, to contribute to the assessment of ecological integrity in forest and wetland ecosystems;
- Facilitate data publication to the public, resource managers, academic institutions, and any other relevant agencies
Methods
Data collection
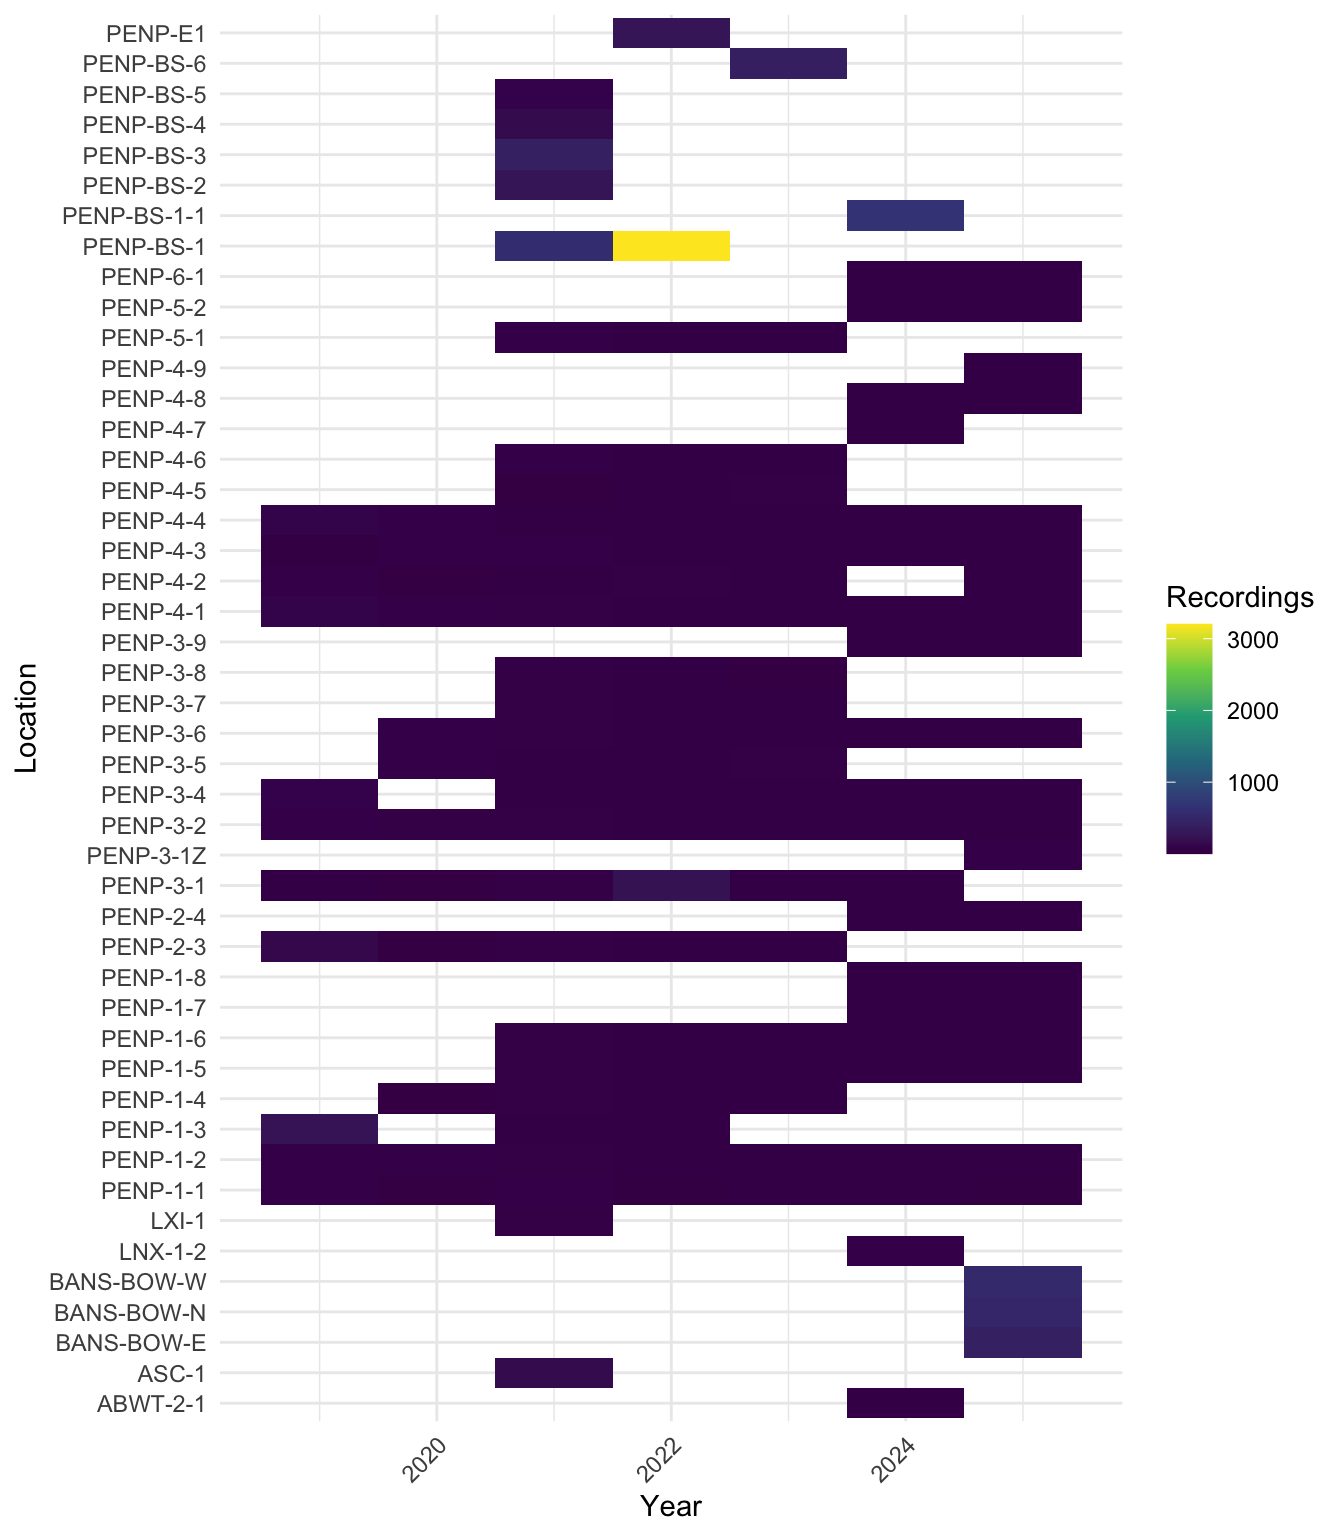
Data were collected during the spring and summer seasons from 2019 to 2025. A total of 43 locations were surveyed over the seven-year period:
- 31 locations as part of the forest songbird monitoring program (code:
PENP-*) with ARUs recording during the morning hours, - 6 for Bank Swallow Monitoring (code:
PENP-BS-*andBANS-*) with ARUs placed strategically beside ponds recording in the morning and evening hours, - 2 locations deployed in First Nations communities (
ASC-1, LXI-1) to complement the forest songbird schedules, - And one location (
PENP-E1), which was to examine the effects of a single public event in 2022
Locations were surveyed on rotation with 6 locations (PENP-1-1, PENP-1-2, PENP-3-2, PENP-4-1, PENP-4-3, PENP-4-4) surveyed each year. A detailed list of all survey years can be found in Table 1 and illustrated in Figure 1. ARUs were deployed at the beginning of the breeding season in April-May, and rotated locations until their final retrieval in July-August. At the forest songbird locations (PENP-*), the ARUs were set to record for 30 minutes continuously every hour for four hours, starting one hour before dawn and ending three hours after dawn. For Bank Swallow Monitoring locations (PENP-BS,BANS-), recordings were made every 20 minutes for a duration of 15 minutes each during dawn and dusk hours 1.5 hours.
| Location | 2019 | 2020 | 2021 | 2022 | 2023 | 2024 | 2025 | Site | years_surveyed | survey_coverage |
|---|---|---|---|---|---|---|---|---|---|---|
| PENP-1-1 | 1 | 1 | 1 | 1 | 1 | 1 | 1 | Cavendish | 7 | Full Survey |
| PENP-1-2 | 1 | 1 | 1 | 1 | 1 | 1 | 1 | Cavendish | 7 | Full Survey |
| PENP-1-3 | 1 | 0 | 1 | 1 | 0 | 0 | 0 | Cavendish | 3 | Some Years |
| PENP-2-3 | 1 | 1 | 1 | 1 | 1 | 0 | 0 | Brackley | 5 | Majority of Years |
| PENP-3-1 | 1 | 1 | 1 | 1 | 1 | 1 | 0 | Dalvay | 6 | Majority of Years |
| PENP-3-2 | 1 | 1 | 1 | 1 | 1 | 1 | 1 | Dalvay | 7 | Full Survey |
| PENP-3-4 | 1 | 0 | 1 | 1 | 1 | 1 | 1 | Dalvay | 6 | Majority of Years |
| PENP-4-1 | 1 | 1 | 1 | 1 | 1 | 1 | 1 | Greenwich | 7 | Full Survey |
| PENP-4-2 | 1 | 1 | 1 | 1 | 1 | 0 | 1 | Greenwich | 6 | Majority of Years |
| PENP-4-3 | 1 | 1 | 1 | 1 | 1 | 1 | 1 | Greenwich | 7 | Full Survey |
| PENP-4-4 | 1 | 1 | 1 | 1 | 1 | 1 | 1 | Greenwich | 7 | Full Survey |
| PENP-1-4 | 0 | 1 | 1 | 1 | 1 | 0 | 0 | Cavendish | 4 | Majority of Years |
| PENP-3-5 | 0 | 1 | 1 | 1 | 1 | 0 | 0 | Dalvay | 4 | Majority of Years |
| PENP-3-6 | 0 | 1 | 1 | 1 | 1 | 1 | 1 | Dalvay | 6 | Majority of Years |
| ASC-1 | 0 | 0 | 1 | 0 | 0 | 0 | 0 | First Nations Communities | 1 | Single Year |
| LXI-1 | 0 | 0 | 1 | 0 | 0 | 0 | 0 | First Nations Communities | 1 | Single Year |
| PENP-1-5 | 0 | 0 | 1 | 1 | 1 | 1 | 1 | Cavendish | 5 | Majority of Years |
| PENP-1-6 | 0 | 0 | 1 | 1 | 1 | 1 | 1 | Cavendish | 5 | Majority of Years |
| PENP-3-7 | 0 | 0 | 1 | 1 | 1 | 0 | 0 | Dalvay | 3 | Some Years |
| PENP-3-8 | 0 | 0 | 1 | 1 | 1 | 0 | 0 | Dalvay | 3 | Some Years |
| PENP-4-6 | 0 | 0 | 1 | 1 | 1 | 0 | 0 | Greenwich | 3 | Some Years |
| PENP-5-1 | 0 | 0 | 1 | 1 | 1 | 0 | 0 | Skmaqn | 3 | Some Years |
| PENP-BS-1 | 0 | 0 | 1 | 1 | 0 | 0 | 0 | Bank Swallow Monitoring | 2 | Some Years |
| PENP-BS-2 | 0 | 0 | 1 | 0 | 0 | 0 | 0 | Bank Swallow Monitoring | 1 | Single Year |
| PENP-BS-3 | 0 | 0 | 1 | 0 | 0 | 0 | 0 | Bank Swallow Monitoring | 1 | Single Year |
| PENP-BS-4 | 0 | 0 | 1 | 0 | 0 | 0 | 0 | Bank Swallow Monitoring | 1 | Single Year |
| PENP-BS-5 | 0 | 0 | 1 | 0 | 0 | 0 | 0 | Bank Swallow Monitoring | 1 | Single Year |
| PENP-4-5 | 0 | 0 | 0 | 1 | 1 | 0 | 0 | Greenwich | 2 | Some Years |
| PENP-E1 | 0 | 0 | 0 | 1 | 0 | 0 | 0 | Skmaqn | 1 | Single Year |
| PENP-BS-6 | 0 | 0 | 0 | 0 | 1 | 0 | 0 | Bank Swallow Monitoring | 1 | Single Year |
| PENP-1-7 | 0 | 0 | 0 | 0 | 0 | 1 | 1 | Cavendish | 2 | Some Years |
| PENP-1-8 | 0 | 0 | 0 | 0 | 0 | 1 | 1 | Cavendish | 2 | Some Years |
| PENP-2-4 | 0 | 0 | 0 | 0 | 0 | 1 | 1 | Brackley | 2 | Some Years |
| PENP-3-9 | 0 | 0 | 0 | 0 | 0 | 1 | 1 | Dalvay | 2 | Some Years |
| PENP-4-7 | 0 | 0 | 0 | 0 | 0 | 1 | 0 | Greenwich | 1 | Single Year |
| PENP-4-8 | 0 | 0 | 0 | 0 | 0 | 1 | 1 | Greenwich | 2 | Some Years |
| PENP-5-2 | 0 | 0 | 0 | 0 | 0 | 1 | 1 | Skmaqn | 2 | Some Years |
| PENP-6-1 | 0 | 0 | 0 | 0 | 0 | 1 | 1 | North Rustico | 2 | Some Years |
| BANS-BOW-E | 0 | 0 | 0 | 0 | 0 | 0 | 1 | Bank Swallow Monitoring | 1 | Single Year |
| BANS-BOW-N | 0 | 0 | 0 | 0 | 0 | 0 | 1 | Bank Swallow Monitoring | 1 | Single Year |
| BANS-BOW-W | 0 | 0 | 0 | 0 | 0 | 0 | 1 | Bank Swallow Monitoring | 1 | Single Year |
| PENP-3-1Z | 0 | 0 | 0 | 0 | 0 | 0 | 1 | Dalvay | 1 | Single Year |
| PENP-4-9 | 0 | 0 | 0 | 0 | 0 | 0 | 1 | Greenwich | 1 | Single Year |
Data management
A total of 12456 recordings were collected (see Figure 2). From 2019 - 2021, data were transferred via hard drive to the University of Alberta in Edmonton, where they are redundantly stored on a server known as Cirrus. The recordings were standardized to ensure adherence to the naming convention of LOCATION_DATETIME, such as PENP-1-1_20230625_053500.wav. The remaining recordings (2022 - 2025) were directly uploaded to WildTrax.
Community data processing
The principal goal for community data processing was to describe all species and individuals heard on each recording while choosing a large enough subset of recordings for analyses. To ensure balanced replication, for each location and year surveyed, four randomly selected recordings were processed for 3-minutes between the hours of 4:00 AM - 7:59 AM ideally on four separate dates (see Table 2). Four recordings will ensure that we have the minimum number of samples for a simple occupancy analysis (Darryl I. MacKenzie et al. (2002) and Darryl I. MacKenzie et al. (2003)). Tags are made using count-removal (see Farnsworth et al. (2002), Sólymos et al. (2018)) where tags are only made at the time of first detection of each individual heard on the recordings by drawing a box around the signal (MacPhail et al. (2026)). In case a species was overly abundant a TMTT (‘too many to tag’) flag was used (see Table 4). 0% of the total tags were TMTT but were subsequently converted to numeric using wildrtrax::wt_replace_tmtt. We also verified that all tags that were created were checked by a second observer (n = 1.13) to ensure accuracy of detections (see Table 3). Amphibian abundance was estimated at the time of first detection using the North American Amphibian Monitoring Program with abundance of species being estimated on the scale of “calling intensity index” (CI) of 1 - 3. Mammals such as Red Squirrel, were also noted on the recordings. After the data are processed in WildTrax, the wildrtrax package is use to download the data into a standard format prepared for analysis. The wt_download_report function downloads the data directly to a R framework for easy manipulation (see wildrtrax APIs). Species were assigned to guilds using the Birds of North America, Elton Traits Database and bird guidebooks (Table 5).
| location | recording_date_time | task_method | recording_sample_frequency | task_duration | task_is_complete | observer | task_comments | internal_task_id |
|---|---|---|---|---|---|---|---|---|
| PENP-6-1 | 2024-06-27 06:23:00 | 1SPT | 44100 | 180 | TRUE | Enid Cumming | NA | 1694861 |
| PENP-1-5 | 2024-06-09 07:21:00 | 1SPT | 44100 | 180 | TRUE | Enid Cumming | NA | 1694862 |
| PENP-5-2 | 2024-06-28 04:24:00 | 1SPT | 44100 | 180 | TRUE | Enid Cumming | NA | 1694863 |
| PENP-1-5 | 2024-06-07 04:21:00 | 1SPT | 44100 | 180 | TRUE | Enid Cumming | NA | 1694864 |
| PENP-2-4 | 2024-05-27 06:27:00 | 1SPT | 44100 | 180 | TRUE | Enid Cumming | good recording | 1694865 |
| PENP-1-5 | 2024-06-08 05:21:00 | 1SPT | 44100 | 180 | TRUE | Enid Cumming | NA | 1694866 |
| Tag is verified | Count | Proportion |
|---|---|---|
| FALSE | 2359 | 30.55 |
| TRUE | 5271 | 68.25 |
| NA | 93 | 1.20 |
| location | recording_date_time | species_code | abundance |
|---|---|---|---|
| PENP-3-1 | 2024-05-20 05:33:00 | CANG | TMTT |
| PENP-3-4 | 2024-05-28 06:26:00 | CANG | TMTT |
| PENP-3-4 | 2024-05-28 07:26:00 | CANG | TMTT |
| PENP-3-4 | 2024-06-01 06:23:00 | CANG | TMTT |
| PENP-4-4 | 2024-06-07 04:19:00 | AMRO | TMTT |
| PENP-3-2 | 2025-07-17 07:37:00 | CANG | TMTT |
| species_common_name | habitat_nesting |
|---|---|
| Alder Flycatcher | Treed/Shrubby Swamp |
| American Redstart | Mixed Woodlands |
| Baltimore Oriole | Open Woodlands |
| Bay-breasted Warbler | Coniferous woodland |
| Black-and-white Warbler | Mixed Woodlands |
| Black-backed Woodpecker | Coniferous woodland |
| Black-throated Blue Warbler | Mixed Woodlands |
| Black-throated Green Warbler | Coniferous woodland |
| Blackburnian Warbler | Coniferous woodland |
| Blackpoll Warbler | Coniferous woodland |
| Blue Jay | Open Woodlands |
| Blue-headed Vireo | Mixed Woodlands |
| Boreal Chickadee | Coniferous woodland |
| Brown Creeper | Coniferous woodland |
| Canada Jay | Coniferous woodland |
| Canada Warbler | Mixed Woodlands |
| Cape May Warbler | Coniferous woodland |
| Chestnut-sided Warbler | Mixed Woodlands |
| Chipping Sparrow | Open Woodlands |
| Common Nighthawk | Open Woodlands |
| Dark-eyed Junco | Coniferous woodland |
| Downy Woodpecker | Mixed Woodlands |
| Eastern Wood-Pewee | Open Woodlands |
| Fox Sparrow | Open Woodlands |
| Golden-crowned Kinglet | Coniferous woodland |
| Gray Catbird | Mixed Woodlands |
| Hairy Woodpecker | Mixed Woodlands |
| Hermit Thrush | Coniferous woodland |
| Lincoln’s Sparrow | Treed/Shrubby Swamp |
| Magnolia Warbler | Mixed Woodlands |
| Mountain Bluebird | Open Woodlands |
| Mourning Warbler | Mixed Woodlands |
| Northern Flicker | Mixed Woodlands |
| Northern Parula | Open Woodlands |
| Orange-crowned Warbler | Open Woodlands |
| Philadelphia Vireo | Mixed Woodlands |
| Pileated Woodpecker | Mixed Woodlands |
| Pine Warbler | Coniferous woodland |
| Red-eyed Vireo | Mixed Woodlands |
| Ruby-crowned Kinglet | Coniferous woodland |
| Ruffed Grouse | Mixed Woodlands |
| Rusty Blackbird | Treed/Shrubby Swamp |
| Swainson’s Thrush | Mixed Woodlands |
| Veery | Mixed Woodlands |
| Warbling Vireo | Mixed Woodlands |
| Western Wood-Pewee | Open Woodlands |
| Yellow-bellied Sapsucker | Mixed Woodlands |
| Yellow-rumped Warbler | Coniferous woodland |
Bank swallows
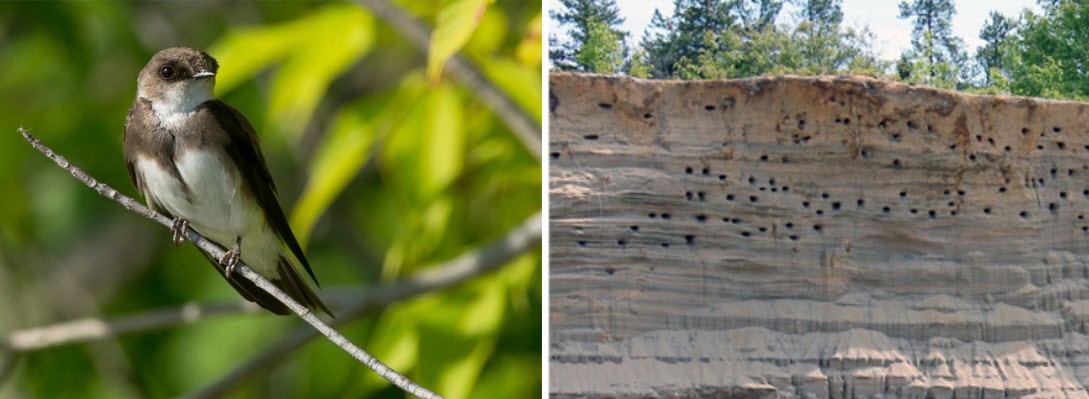
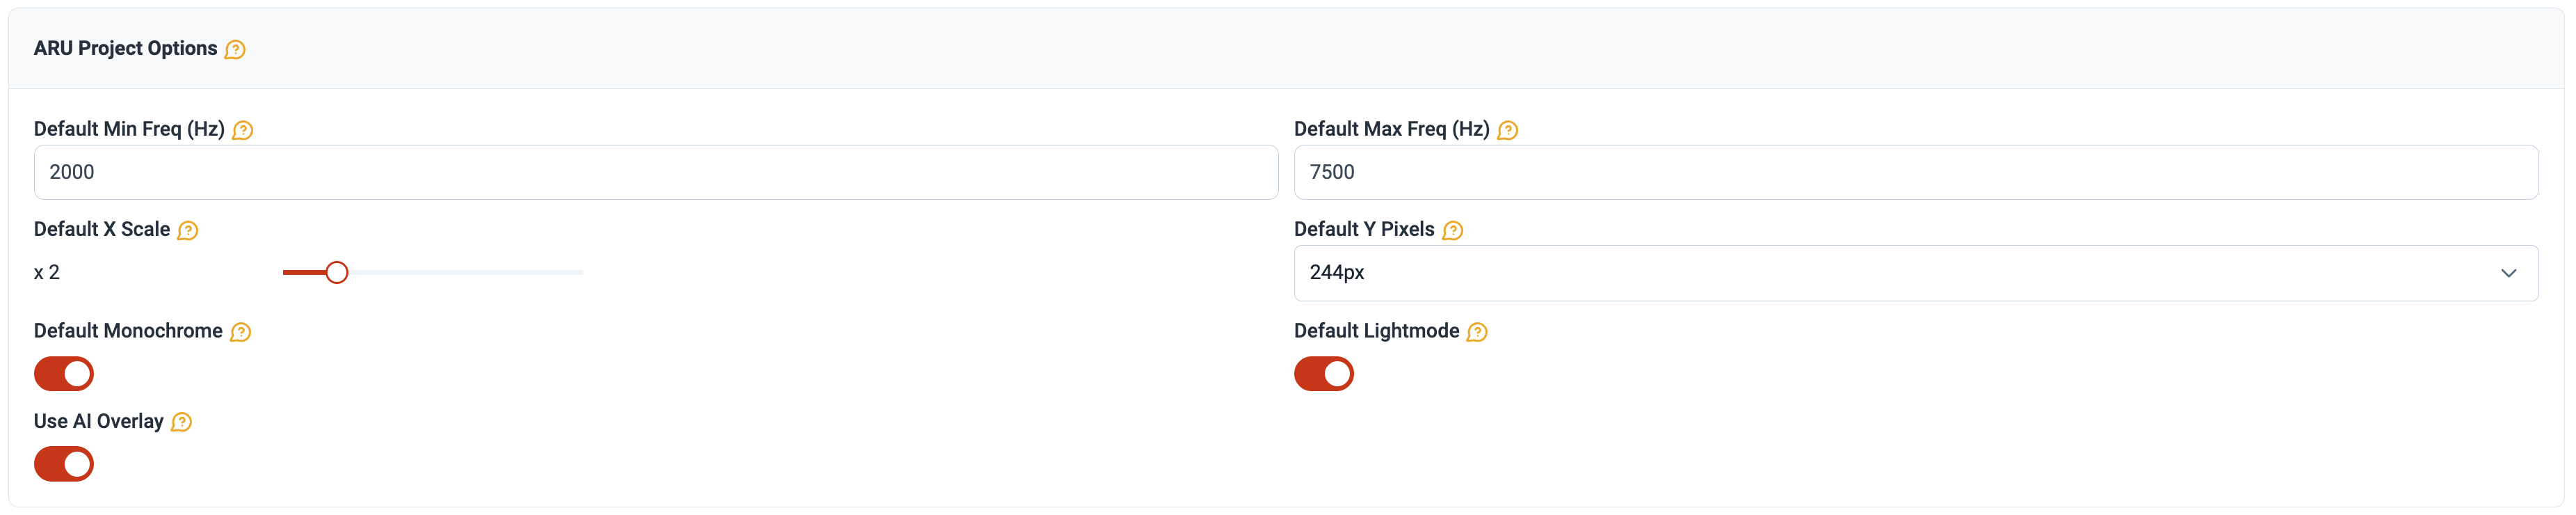
Bank Swallow (Riparia riparia) are federally listed as threatened in Canada and produce distinctive, broadband vocalizations that are readily identifiable on a spectrogram. ARUs were placed near ponds, which may support roosting and pre-migratory staging aggregations in late summer. Documenting the timing and density of vocalizations during dawn and dusk periods can reveal whether ARUs capture acoustic signatures consistent with roosting behaviour, such as sustained high call-rate events associated with group entry or departure from wetland sites. All targeted recordings were reviewed by a trained observer using visual scanning, a method in which spectrograms are examined rather than listened to, allowing faster processing with comparable biological accuracy (Cameron et al. (2020); Garland et al. (2020); Ware et al. (2023)). We refined processing using dynamic spectrogram settings in WildTrax (Figure 3), constraining the frequency range to the 95% CI of Bank Swallow vocalizations (2,000–7,500 Hz) and expanding the time window (1× → 2×) to reduce visual noise and expedite detection. To complement visual scanning and reduce false negatives, we evaluated two automated classifiers, BirdNET v2.1 (Kahl et al. (2021)) and HawkEars v1.0.8 (Huus et al. (2025)), against the human-verified detection record using precision-recall analysis. Classifier outputs were overlaid directly on spectrograms in WildTrax, allowing reviewers to apply expert judgment where classifier confidence was low.
Detections were examined by year and location to account for variation in deployment configuration across monitoring seasons. Call counts per recording, rather than binary presence, were used to characterize detection intensity during dawn (04:00–08:00) and dusk (19:00–22:00) periods. Sites monitored under different configurations across years (e.g., Bowley Pond: one unit in 2023, three in 2025) were examined separately to explore whether detector density affected detection rates or call volume. To characterize the temporal distribution of calling activity, recordings were converted to binary presence/absence records and assigned a day of year and hour of day from their timestamps. A generalized additive model (GAM) with a binomial response was fit using mgcv in R, with smooth terms for day of year (thin plate regression spline, k = 10), hour of day (cyclic cubic spline, k = 10), and a tensor product interaction to capture shifting diel patterns across the season (REML estimation).
Automated recognition
Automated recognition is a well-known process to help detect rare and elusive species (Knight and Bayne (2019). Shonfield, Heemskerk, and Bayne (2018)) as well as species that may have a low detectability by collecting large data sets. In order to determine the presence of a few key species-at-risk, we utilized automated recognizers and deployed them across all the recordings in the 2019 data set. We constructed a recognizer for Eastern Wood-Pewee (EAWP) and used three previously constructed Wildlife Acoustics SongScope recognizers for Olive-sided Flycatcher (OSFL), Rusty Blackbird (RUBL) and Canada Warbler (CAWA) to detect for the presence of these species in the 2019 data set. Hits were verified and true positives for presence at each location (recording where the species was first positively detected) were uploaded to WildTrax via the wt_songscope_tags function in wildrtrax for verification.
Analyses
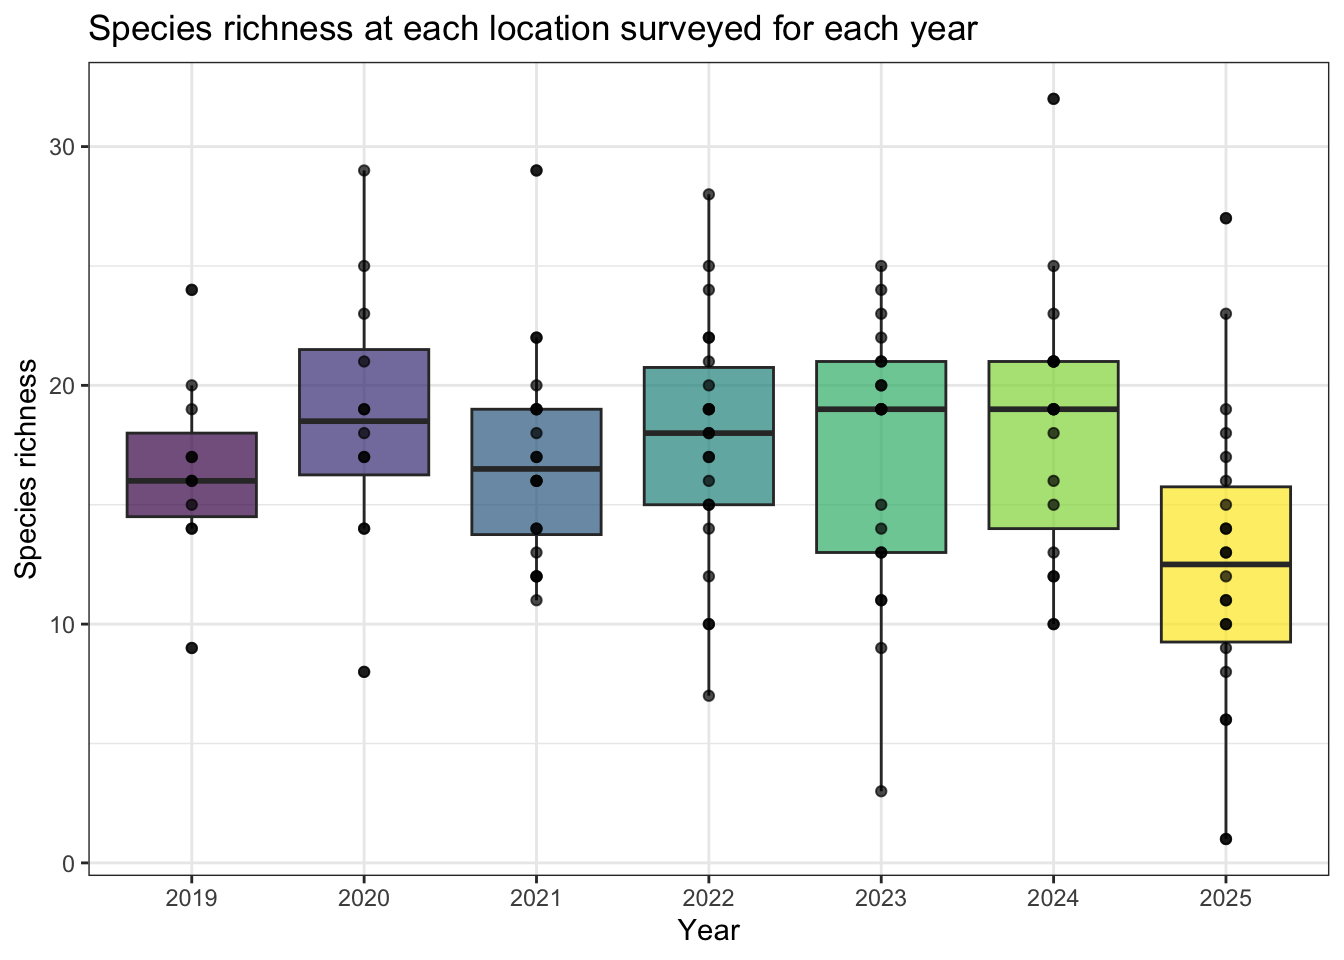
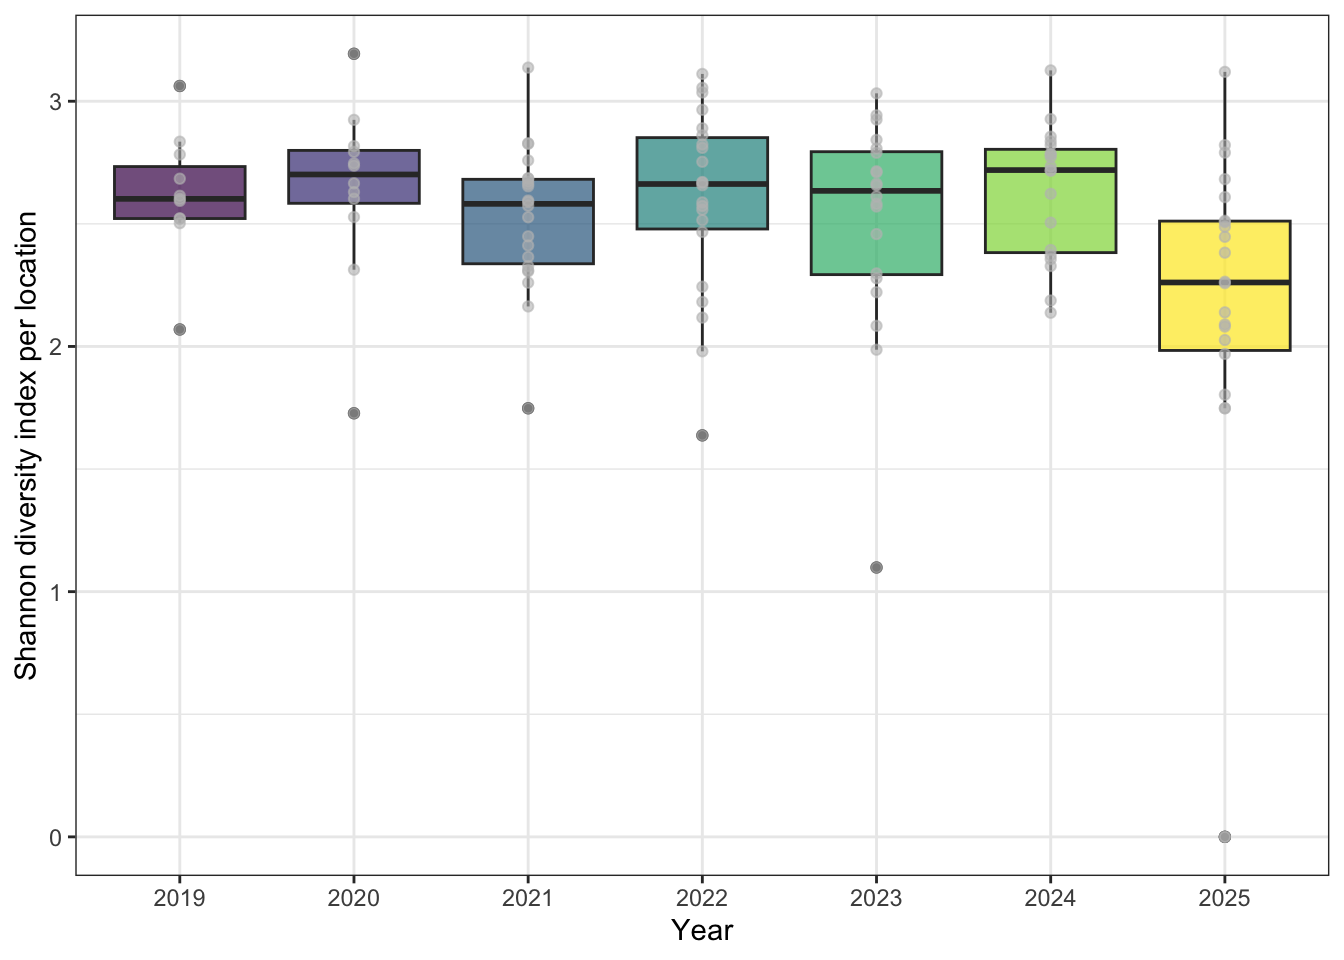
Species richness, diversity and occupancy were calculated using the 43, 9 forest songbird monitoring locations (PENP-). We calculated species richness as distinct species found at each location and year surveyed (see Figure 4), omitting species using wildrtrax::wt_tidy_species() for abiotic, amphibians, unknowns and insects. To determine if there were any changes to species diversity, we used Shannon’s diversity index (Shannon (1948)) over years using vegan::diversity(index="shannon") (see Figure 5).
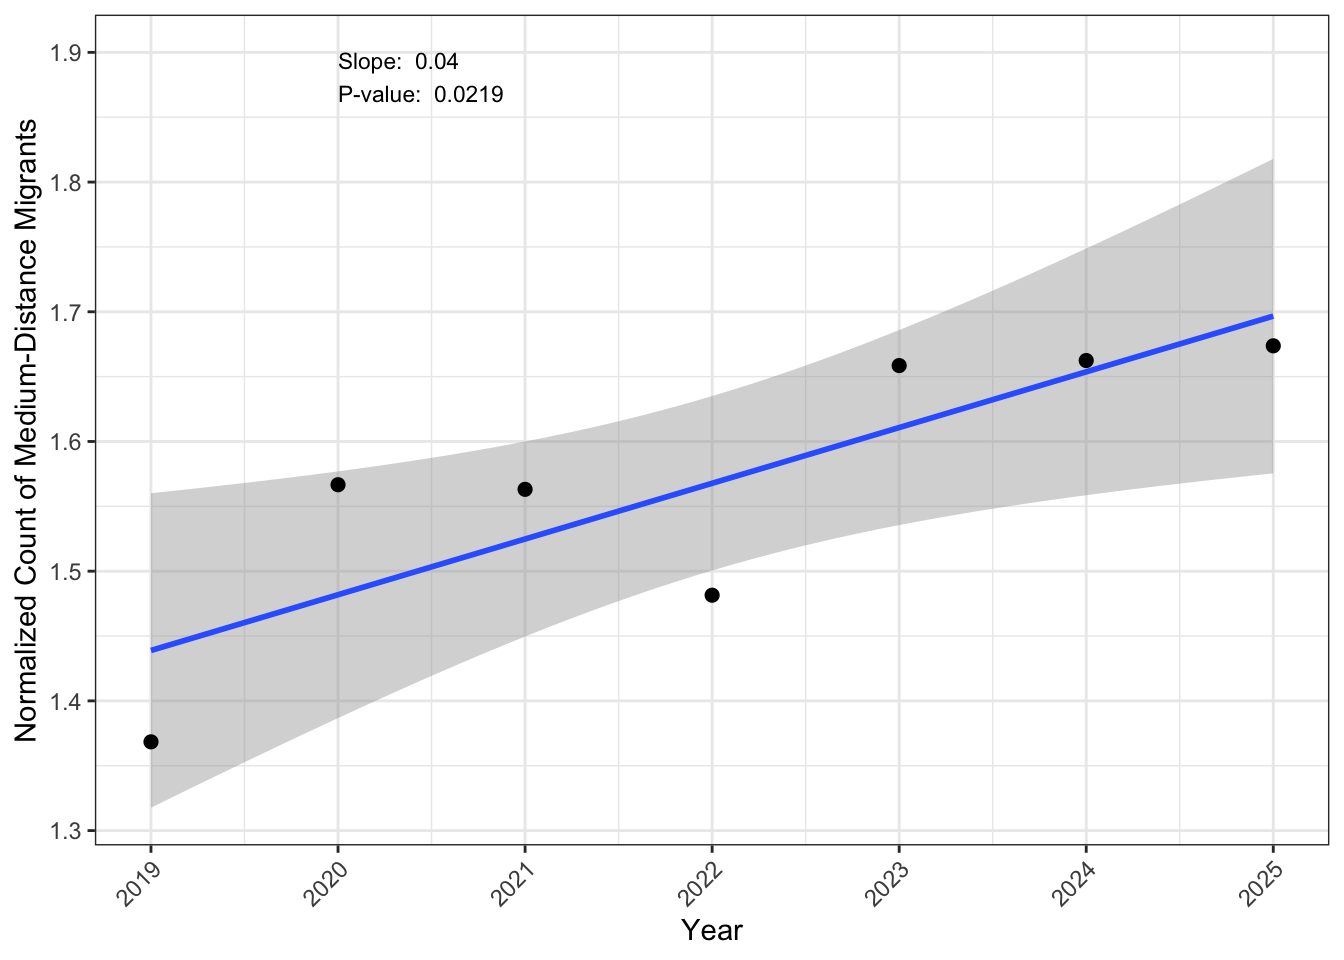
For testing species occupancy, we selected locations with a minimum of four dawn visits for each year across all five years, focusing on forest obligate species for ecological relevance (see Table 5). Utilizing a single-season single-species occupancy model from Darryl I. MacKenzie et al. (2002), we calculated the predicted occupancy of species at all locations surveyed in each year across years. Site-specific covariates included the distance to ocean edge (in meters) and the proportional area of each cover type from the Prince Edward Island 2010 Corporate Land Use Inventory at 150 meter radius surrounding the ARU categorized into anthropogenic (pavement, soy), open (grass, sand dune, bare soil), deciduous (red maple, white birch, alder, poplar) and conifer (white spruce, black spruce, balsam fir). Observation covariates incorporated day of the year, hour, observer, and a quadratic term for both day of year (\(doy^{2}\)) and hour (\(hr^{2}\)). See Table 6 for more information. Despite variations in processing methodology between 2019 - 2021 (1SPM - species-individual detected per minute, i.e. repeat sampling each minute for 3 minute) and subsequent years (2022 - 2025; 1SPT), we maintained consistency by exclusively utilizing the time to the first detection of individuals from the 1SPM recordings. Model predictions were generated, with goodness-of-fit testing using methods from Darryl I. MacKenzie and Bailey (2004) and the best model selected based on AIC and through MuMIn::dregde, MuMIn::get.models and MuMIn::model.sel. If more than one model existed, the average model was used using MuMIn::model.avg. The final predictions were then made and plotted over years and sorted by nesting guilds of species into conifer, deciduous, treed / shrubby, wetlands and open. Trends in species abundance were assessed using a normalized count, calculated as the total species count divided by the number of surveyed locations per year. We focused on a subset of species representative of the forest songbird community: BTNW, BLBW, GCKI, YRWA, MAWA, BTBW, BHVI, AMRE, REVI, MOWA, BLJA, ALFL, EAWP, WTSP, AMRO, COYE, NOPA, YEWA. To evaluate temporal trends in abundance over the past six years, we applied generalized linear mixed models (GLMMs) each species as well as the total count of the species over the period.
| location | Distance from coast (m) | Conifer | Deciduous | Wetlands | Anthro | Open | NA |
|---|---|---|---|---|---|---|---|
| BANS-BOW-E | 546.24 | 0.06 | 0.01 | 0.93 | 0.00 | 0.00 | 0.00 |
| BANS-BOW-N | 166.77 | 0.00 | 0.00 | 1.00 | 0.00 | 0.00 | 0.00 |
| BANS-BOW-W | 456.45 | 0.00 | 0.07 | 0.93 | 0.00 | 0.00 | 0.00 |
| PENP-1-1 | 843.54 | 0.00 | 0.04 | 0.00 | 0.83 | 0.13 | 0.00 |
| PENP-1-2 | 428.46 | 0.95 | 0.00 | 0.04 | 0.01 | 0.00 | 0.00 |
| PENP-1-3 | 1609.91 | 0.85 | 0.03 | 0.00 | 0.03 | 0.09 | 0.00 |
| PENP-1-4 | 106.02 | 0.91 | 0.00 | 0.09 | 0.00 | 0.00 | 0.00 |
| PENP-1-5 | 2147.58 | 0.08 | 0.92 | 0.00 | 0.00 | 0.01 | 0.00 |
| PENP-1-6 | 1695.94 | 0.03 | 0.00 | 0.00 | 0.00 | 0.97 | 0.00 |
| PENP-1-7 | 655.50 | 0.20 | 0.44 | 0.00 | 0.18 | 0.18 | 0.00 |
| PENP-1-8 | 476.88 | 0.45 | 0.08 | 0.00 | 0.05 | 0.43 | 0.00 |
| PENP-2-3 | 114.49 | 0.39 | 0.42 | 0.08 | 0.02 | 0.08 | 0.00 |
| PENP-2-4 | 324.50 | 0.21 | 0.66 | 0.00 | 0.07 | 0.06 | 0.00 |
| PENP-3-1 | 971.57 | 0.21 | 0.07 | 0.29 | 0.00 | 0.00 | 0.43 |
| PENP-3-1Z | 967.25 | 0.27 | 0.03 | 0.27 | 0.00 | 0.00 | 0.44 |
| PENP-3-2 | 664.74 | 0.14 | 0.35 | 0.10 | 0.00 | 0.00 | 0.42 |
| PENP-3-4 | 378.32 | 0.24 | 0.44 | 0.32 | 0.00 | 0.00 | 0.00 |
| PENP-3-5 | 66.67 | 0.36 | 0.05 | 0.49 | 0.10 | 0.00 | 0.00 |
| PENP-3-6 | 1243.54 | 0.55 | 0.45 | 0.00 | 0.00 | 0.00 | 0.00 |
| PENP-3-7 | 424.88 | 0.34 | 0.00 | 0.00 | 0.56 | 0.10 | 0.00 |
| PENP-3-8 | 107.72 | 0.48 | 0.00 | 0.13 | 0.04 | 0.35 | 0.00 |
| PENP-3-9 | 785.01 | 0.45 | 0.00 | 0.49 | 0.04 | 0.01 | 0.00 |
| PENP-4-1 | 431.00 | 0.34 | 0.41 | 0.25 | 0.00 | 0.00 | 0.00 |
| PENP-4-2 | 726.48 | 0.40 | 0.55 | 0.00 | 0.00 | 0.05 | 0.00 |
| PENP-4-3 | 1260.58 | 0.68 | 0.00 | 0.32 | 0.00 | 0.00 | 0.00 |
| PENP-4-4 | 544.80 | 1.00 | 0.00 | 0.00 | 0.00 | 0.00 | 0.00 |
| PENP-4-5 | 584.35 | 0.00 | 0.43 | 0.57 | 0.00 | 0.00 | 0.00 |
| PENP-4-6 | 797.80 | 0.15 | 0.85 | 0.00 | 0.00 | 0.00 | 0.00 |
| PENP-4-7 | 303.88 | 0.68 | 0.00 | 0.31 | 0.00 | 0.00 | 0.00 |
| PENP-4-8 | 314.07 | 0.67 | 0.00 | 0.33 | 0.00 | 0.00 | 0.00 |
| PENP-4-9 | 1183.76 | 0.43 | 0.56 | 0.00 | 0.01 | 0.00 | 0.00 |
| PENP-5-1 | 161.81 | 0.64 | 0.00 | 0.00 | 0.00 | 0.36 | 0.00 |
| PENP-5-2 | 401.66 | 0.28 | 0.00 | 0.14 | 0.00 | 0.58 | 0.00 |
| PENP-6-1 | 577.46 | 0.67 | 0.00 | 0.18 | 0.15 | 0.00 | 0.00 |
| PENP-BS-1 | 596.84 | 0.11 | 0.17 | 0.39 | 0.23 | 0.09 | 0.00 |
| PENP-BS-2 | 271.69 | 0.11 | 0.00 | 0.51 | 0.08 | 0.29 | 0.00 |
| PENP-BS-3 | 134.70 | 0.30 | 0.00 | 0.13 | 0.46 | 0.11 | 0.00 |
| PENP-BS-4 | 214.20 | 0.38 | 0.00 | 0.43 | 0.01 | 0.18 | 0.00 |
| PENP-BS-5 | 369.78 | 0.00 | 0.00 | 1.00 | 0.00 | 0.00 | 0.00 |
| PENP-BS-6 | 478.35 | 0.00 | 0.09 | 0.91 | 0.00 | 0.00 | 0.00 |
Results
Species richness and diversity
A total of 102 species were found across the seven years. Figure 4 describes the relationship of species richness for each location across survey year. Shannon’s diversity was stable based on results (see Figure 5).
Proximity to ocean effects
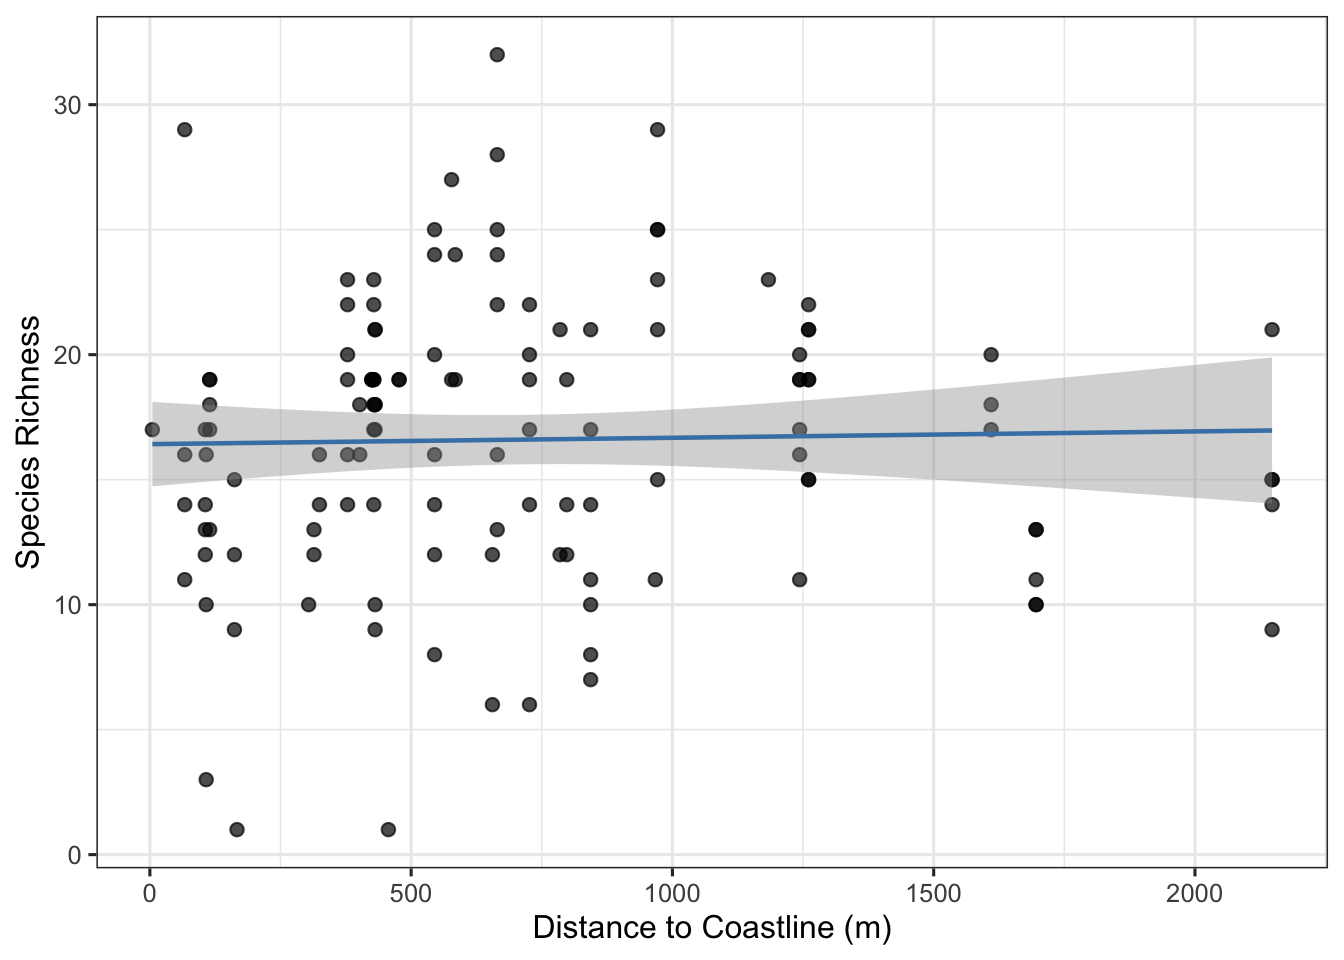
Proximity to the ocean may influence avian species richness detected at ARU stations through elevated ambient noise levels. Wave action and wind-driven coastal noise can reduce the effective detection distance of ARUs, potentially masking vocalizations and leading to systematic underdetection at exposed coastal sites (Pijanowski et al. (2011)). To examine whether distance to the nearest coastline was associated with observed species richness, we compared species counts across monitoring locations as a function of coast distance. Contrary to expectations, distance to the nearest coastline showed no meaningful association with species richness across ARU monitoring locations (see Figure 7). Species richness was highly variable at all distances, ranging from approximately 3–32 species regardless of coastal proximity, and the fitted regression line was nearly flat across the full range of distances sampled (0-2, 200 m). This suggests that, within PEINP, coastal noise does not appear to systematically suppress acoustic detectability or species richness at the distances represented by our monitoring network, though the majority of stations were clustered within 500 m of the coastline, limiting inference at greater distances.
Trends in abundance over time
Most forest species showed slight increasing and decreasing trends, with only functional gain with White-throated sparrows over the years as seen in Table 7. There were no significant difference in the total abundance of species included in the analyses as demonstrated in Figure 8.
| species_code | term | estimate | std.error | statistic | p.value |
|---|---|---|---|---|---|
| ALFL | (Intercept) | 21.30 | 64.98 | 0.33 | 0.76 |
| ALFL | year | -0.01 | 0.03 | -0.31 | 0.77 |
| AMRE | (Intercept) | -29.08 | 40.20 | -0.72 | 0.50 |
| AMRE | year | 0.02 | 0.02 | 0.76 | 0.48 |
| AMRO | (Intercept) | -35.43 | 34.78 | -1.02 | 0.36 |
| AMRO | year | 0.02 | 0.02 | 1.05 | 0.34 |
| BHVI | (Intercept) | -42.54 | 22.31 | -1.91 | 0.11 |
| BHVI | year | 0.02 | 0.01 | 1.96 | 0.11 |
| BLBW | (Intercept) | -46.79 | 18.10 | -2.59 | 0.05 |
| BLBW | year | 0.02 | 0.01 | 2.65 | 0.05 |
| BLJA | (Intercept) | -30.82 | 46.75 | -0.66 | 0.54 |
| BLJA | year | 0.02 | 0.02 | 0.68 | 0.52 |
| BTBW | (Intercept) | 141.59 | 104.17 | 1.36 | 0.27 |
| BTBW | year | -0.07 | 0.05 | -1.35 | 0.27 |
| BTNW | (Intercept) | -31.51 | 41.81 | -0.75 | 0.48 |
| BTNW | year | 0.02 | 0.02 | 0.78 | 0.47 |
| COYE | (Intercept) | -85.47 | 26.91 | -3.18 | 0.02 |
| COYE | year | 0.04 | 0.01 | 3.22 | 0.02 |
| EAWP | (Intercept) | -11.02 | 12.04 | -0.92 | 0.40 |
| EAWP | year | 0.01 | 0.01 | 1.00 | 0.36 |
| GCKI | (Intercept) | -36.94 | 33.71 | -1.10 | 0.32 |
| GCKI | year | 0.02 | 0.02 | 1.13 | 0.31 |
| MAWA | (Intercept) | -38.45 | 26.25 | -1.46 | 0.20 |
| MAWA | year | 0.02 | 0.01 | 1.51 | 0.19 |
| MOWA | (Intercept) | 0.64 | 36.86 | 0.02 | 0.99 |
| MOWA | year | 0.00 | 0.02 | 0.01 | 0.99 |
| NOPA | (Intercept) | 10.03 | 23.38 | 0.43 | 0.69 |
| NOPA | year | 0.00 | 0.01 | -0.38 | 0.72 |
| REVI | (Intercept) | 77.31 | 22.09 | 3.50 | 0.02 |
| REVI | year | -0.04 | 0.01 | -3.45 | 0.02 |
| WTSP | (Intercept) | -151.76 | 54.54 | -2.78 | 0.04 |
| WTSP | year | 0.08 | 0.03 | 2.81 | 0.04 |
| YEWA | (Intercept) | -121.76 | 53.74 | -2.27 | 0.07 |
| YEWA | year | 0.06 | 0.03 | 2.29 | 0.07 |
| YRWA | (Intercept) | -23.18 | 25.45 | -0.91 | 0.40 |
| YRWA | year | 0.01 | 0.01 | 0.95 | 0.38 |
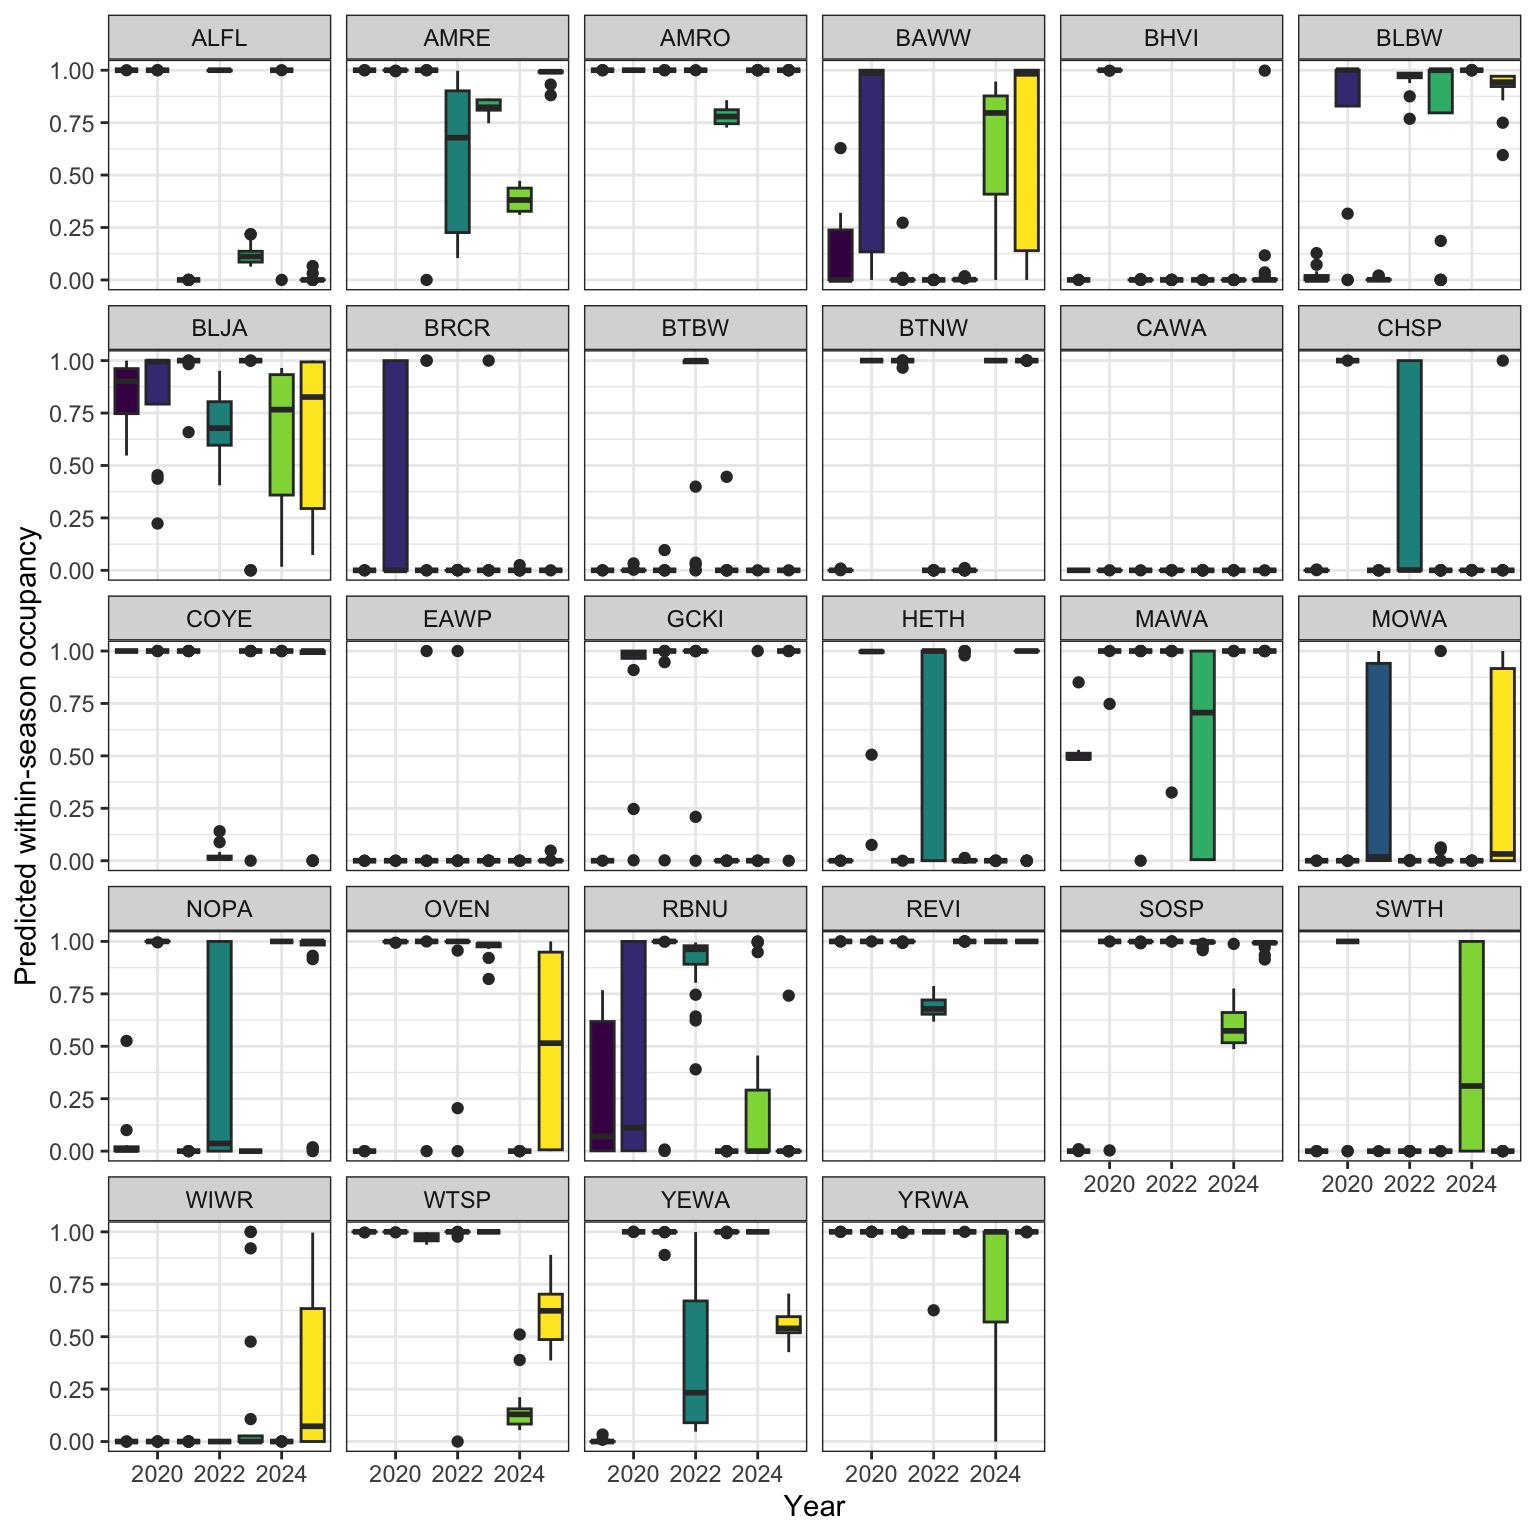
Species occupancy
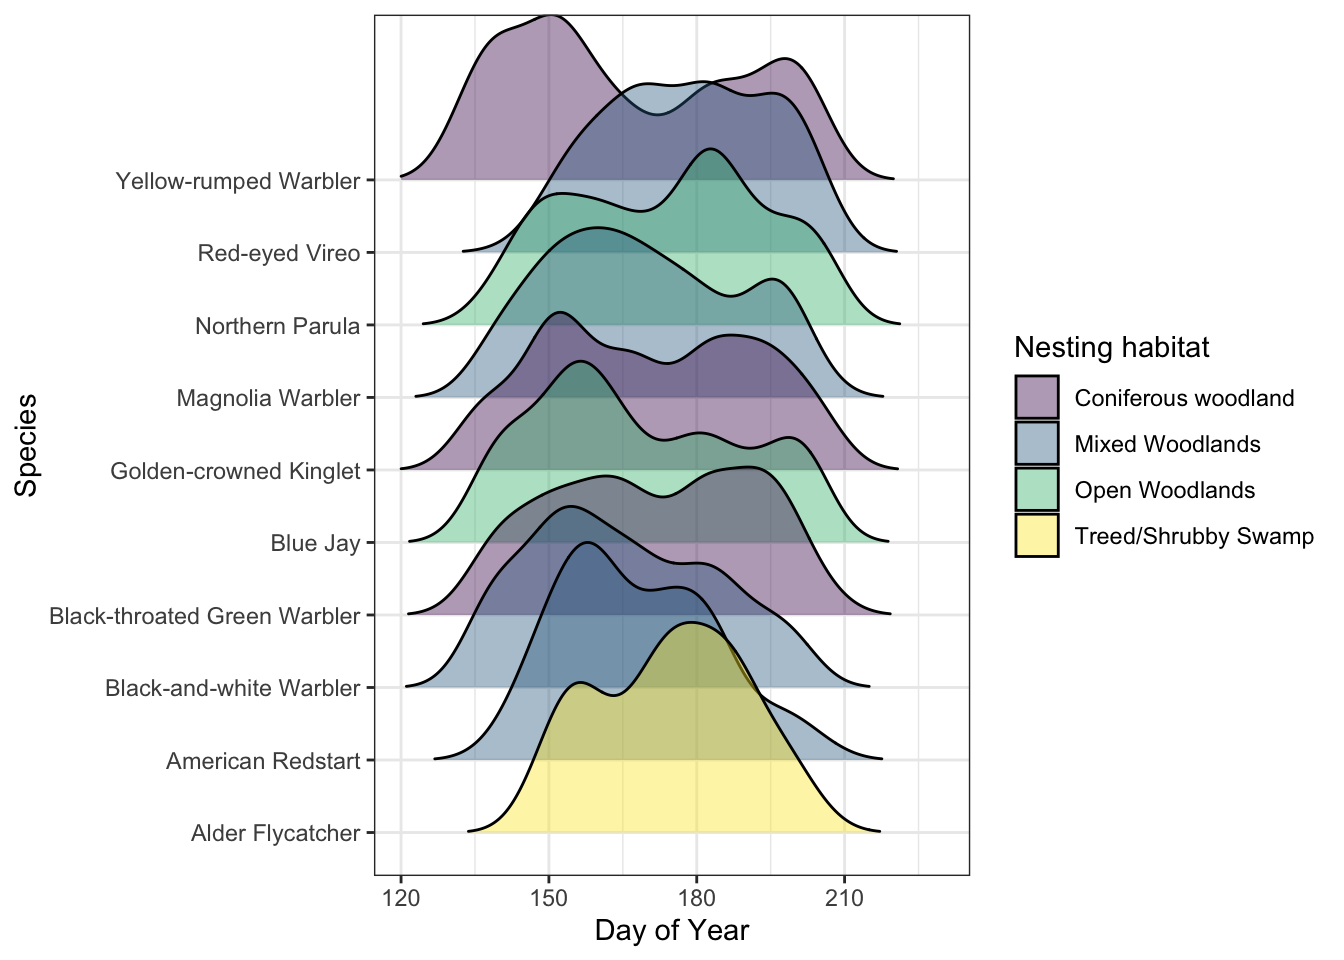
We selected from those same 15 forested species to represent the forest songbird community into 4 separate habitat nesting guilds (see Table 5 and Figure 9). Analysis of species occupancy revealed diverse and varied changes across these species. Analytically, many models were singular, and a few exhibited overdispersion, likely due to low detections or a limited sample size of spatial locations. Ubiquitous species such as Red-eyed Vireo, Yellow-rumped Warbler, Magnolia Warbler and Northern Parula, demonstrated stable site occupancy across the years. Generalist species or those capable of capitalizing on utilizing mixed habitats, exemplified by the Northern Parula, also maintained consistent occupancy levels. There were notable breakpoints in the occupancy of certain species: coniferous species, including the Black-throated Green Warbler, Black-throated Blue Warbler, Blackburnian Warbler, Golden-crowned Kinglet, and Mourning Warbler, experiencing declines in 2023. Conversely, increases were observed in guilds of species that favor more open or shrubby habitats, such as the Alder Flycatcher and American Redstart. Thrushes (American Robin, Swainson’s Thrush, Hermit Thrush) had notably wavering occupancy throughout the years.
Bank swallows
Note
Some of these analyses are still a work-in-progress. Check back soon for updates and additional details.
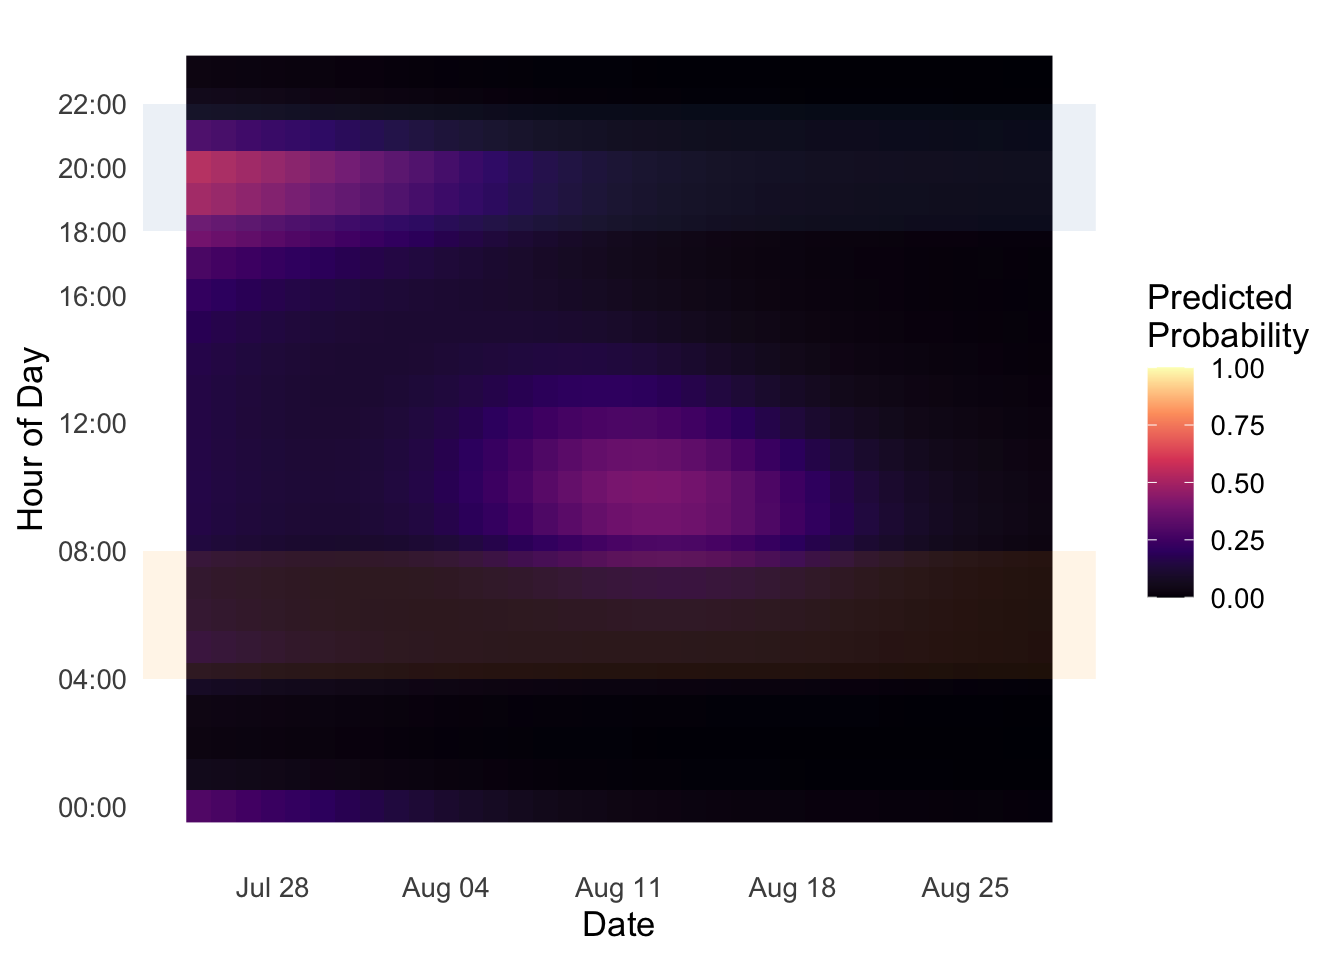
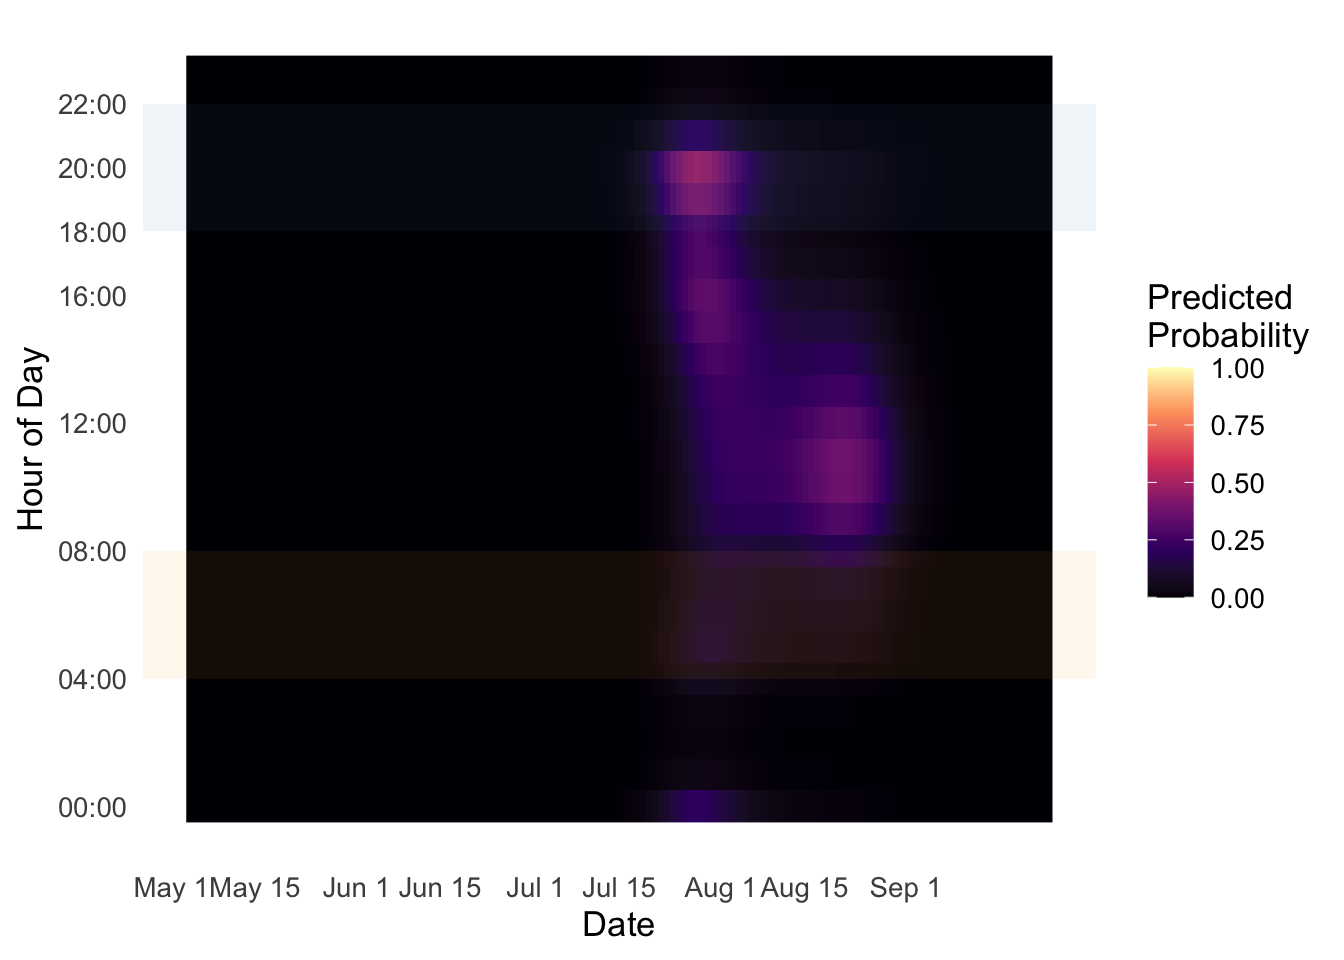
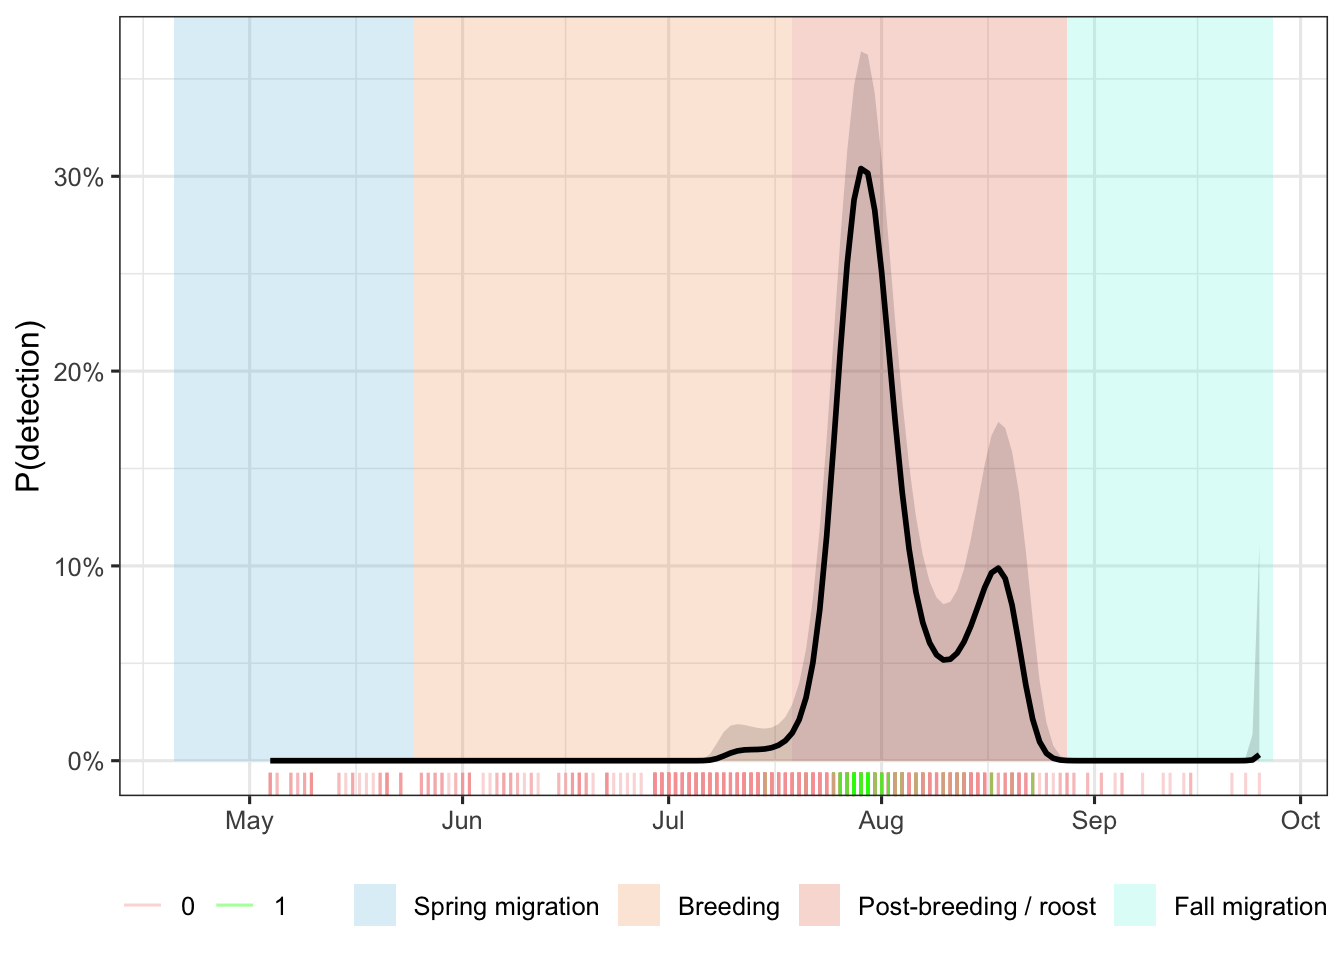
Bank Swallow vocalizations were detected across multiple survey seasons at two primary pond locations within Prince Edward Island National Park (Table 8). A total of 117 unique detection events were recorded across all years combined, with the majority (102; 87% of multi-unit detections) occurring in 2025 at Bowley Pond. 1 detection was recorded in 2021 across five sites totalling 202.5 hours of recording and 21.9 hours (10.81%) analyzed. A small number of detections were recorded at Clarke’s Pond in 2022 (n = 3; 291.9 hours collected, 28.2 hours analyzed) and 2024 (n = 3; 164.8 hours collected, 29.2 hours analyzed), and at Bowley Pond in 2023 (n = 8; 100.2 hours collected, 27.8 hours analyzed). In 2025, three ARUs were deployed simultaneously around Bowley Pond (East, North, and West positions), collectively recording 339.0 hours and yielding 102 detection events across 51.3 analyzed hours, representing a substantial increase relative to all prior years combined. Detection rates per analyzed hour were markedly higher in 2025 (approximately 2.02 detections/hour) compared to the single-unit deployments at Clarke’s Pond in 2022 (0.11 detections/hour) and 2024 (0.10 detections/hour), and at Bowley Pond in 2023 (0.29 detections/hour). Predicted calling probability heatmaps generated from the acoustic data revealed distinct diel and seasonal structure in detected vocalizations (Figure 12, Figure 13) and the results of the GAM are interpreted in (Figure 14). In the Clarke’s Pond dataset, elevated predicted probability was concentrated in a narrow window around early August, primarily between approximately 16:00 and 21:00, consistent with dusk-period activity. A diffuse band of low but non-zero probability was also apparent during the dawn survey window (04:00–08:00 h) across the full survey period. At Bowley Pond in 2025, the predicted calling probability was highest during the dusk window (approximately 18:00–21:00) in the earliest portion of the survey (late July through early August), declining markedly through August. The dawn survey window showed little to no elevated probability at Bowley Pond in 2025.
| Location ID | Site | Survey Period | Hours collected | Hours analyzed | % analyzed | BANS detections | |
|---|---|---|---|---|---|---|---|
| 2021 | |||||||
| PENP-BS-1 | Clarke's Pond | May 04 – Aug 15 | 71.8 | 6.8 | 9.47 | 0 | |
| PENP-BS-2 | Stanhope | May 04 – May 11 | 33.8 | 1.6 | 4.73 | 0 | |
| PENP-BS-3 | Gulf Shore Parkway | May 04 – May 10 | 35.0 | 1.9 | 5.43 | 0 | |
| PENP-BS-4 | North Rustico | Aug 03 – Aug 15 | 37.0 | 7.6 | 20.54 | 1 | |
| PENP-BS-5 | Blooming Point | Aug 03 – Aug 15 | 24.9 | 4.0 | 16.06 | 0 | |
| Total | — | — | — | 202.5 | 21.9 | 10.81 | 1.0 |
| 2022 | |||||||
| PENP-BS-1 | Clarke's Pond | May 16 – Aug 04 | 291.9 | 28.2 | 9.66 | 3 | |
| Total | — | — | — | 291.9 | 28.2 | 9.66 | 3.0 |
| 2023 | |||||||
| PENP-BS-6 | Bowley Pond | Jul 14 – Jul 30 | 100.2 | 27.8 | 27.74 | 8 | |
| Total | — | — | — | 100.2 | 27.8 | 27.74 | 8.0 |
| 2024 | |||||||
| PENP-BS-1-1 | Clarke's Pond | Aug 01 – Sep 25 | 164.8 | 29.2 | 17.72 | 3 | |
| Total | — | — | — | 164.8 | 29.2 | 17.72 | 3.0 |
| 2025 | |||||||
| BANS-BOW-E | Bowley Pond (East) | Jul 25 – Aug 12 | 103.8 | 19.5 | 18.79 | 46 | |
| BANS-BOW-N | Bowley Pond (North) | Jul 25 – Aug 28 | 100.7 | 15.0 | 14.90 | 17 | |
| BANS-BOW-W | Bowley Pond (West) | Jul 25 – Aug 28 | 134.5 | 16.8 | 12.49 | 39 | |
| Total | — | — | — | 339.0 | 51.3 | 15.13 | 102.0 |
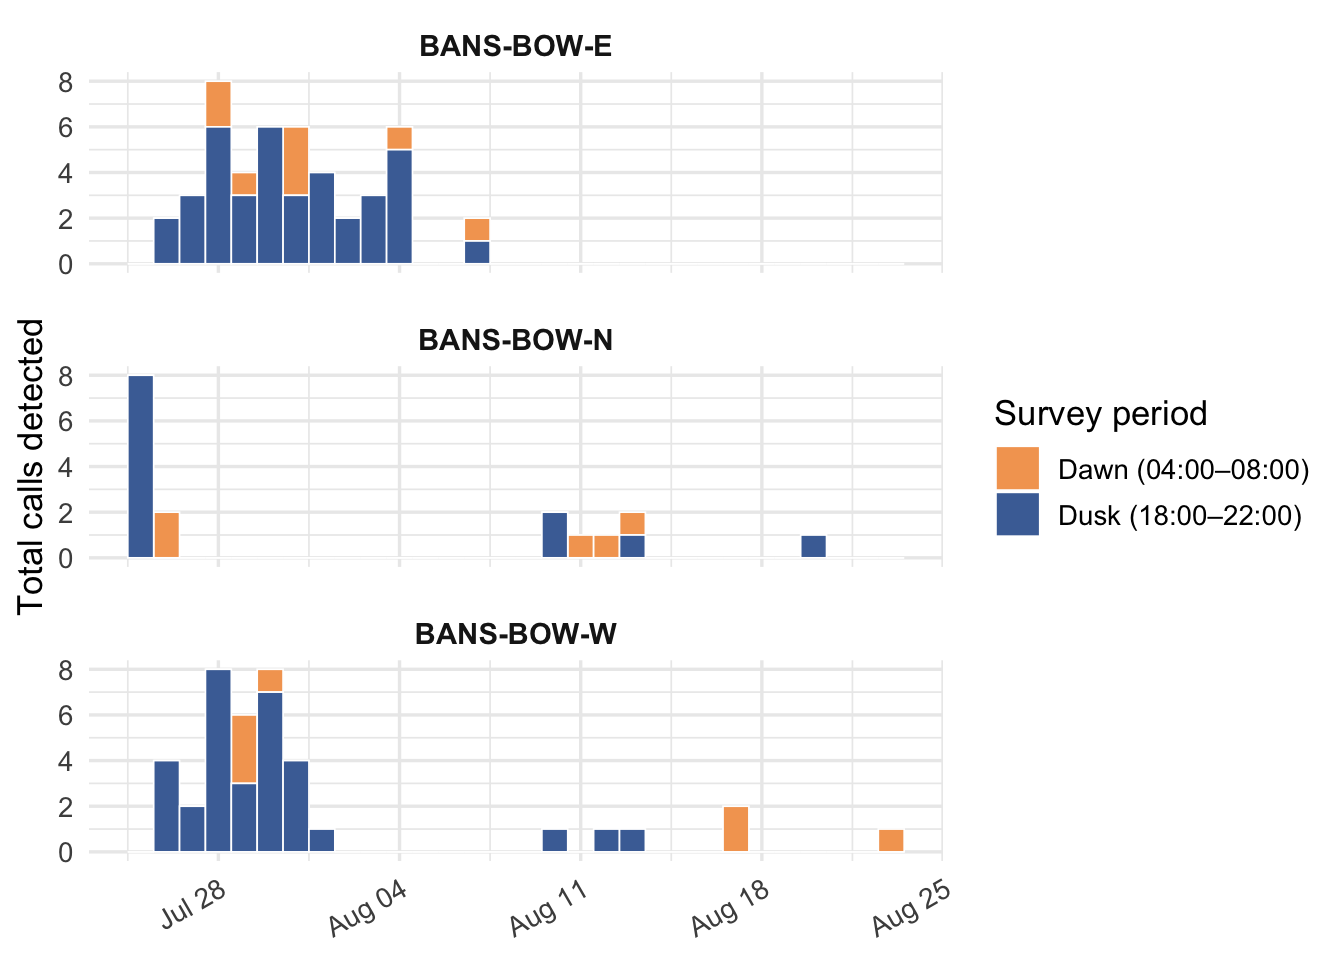
Further breaking down responses at Bowley Pond in 2025, Figure 10 describes the frequency and number of calls detected across the season broken up by dawn and dusk hours of the day throughout the deployment of the recorder. Activity was centered around dusk hours with frequency of detection increasing over the evening hours.
Evaluation of the performance of BirdNET and HawkEars on Bank swallow detections can be summarized in the precision-recall curve in Figure 11. BirdNET v2.1 consistently outperforms HawkEars v1.0.8 across most of the recall range. Precision for BirdNET rises quickly and peaks around moderate recall (~0.3–0.4), indicating a better balance between false positives and detection sensitivity. HawkEars starts relatively strong at low recall but declines steadily, with a pronounced drop at high recall, suggesting it struggles to maintain precision as more detections are included.
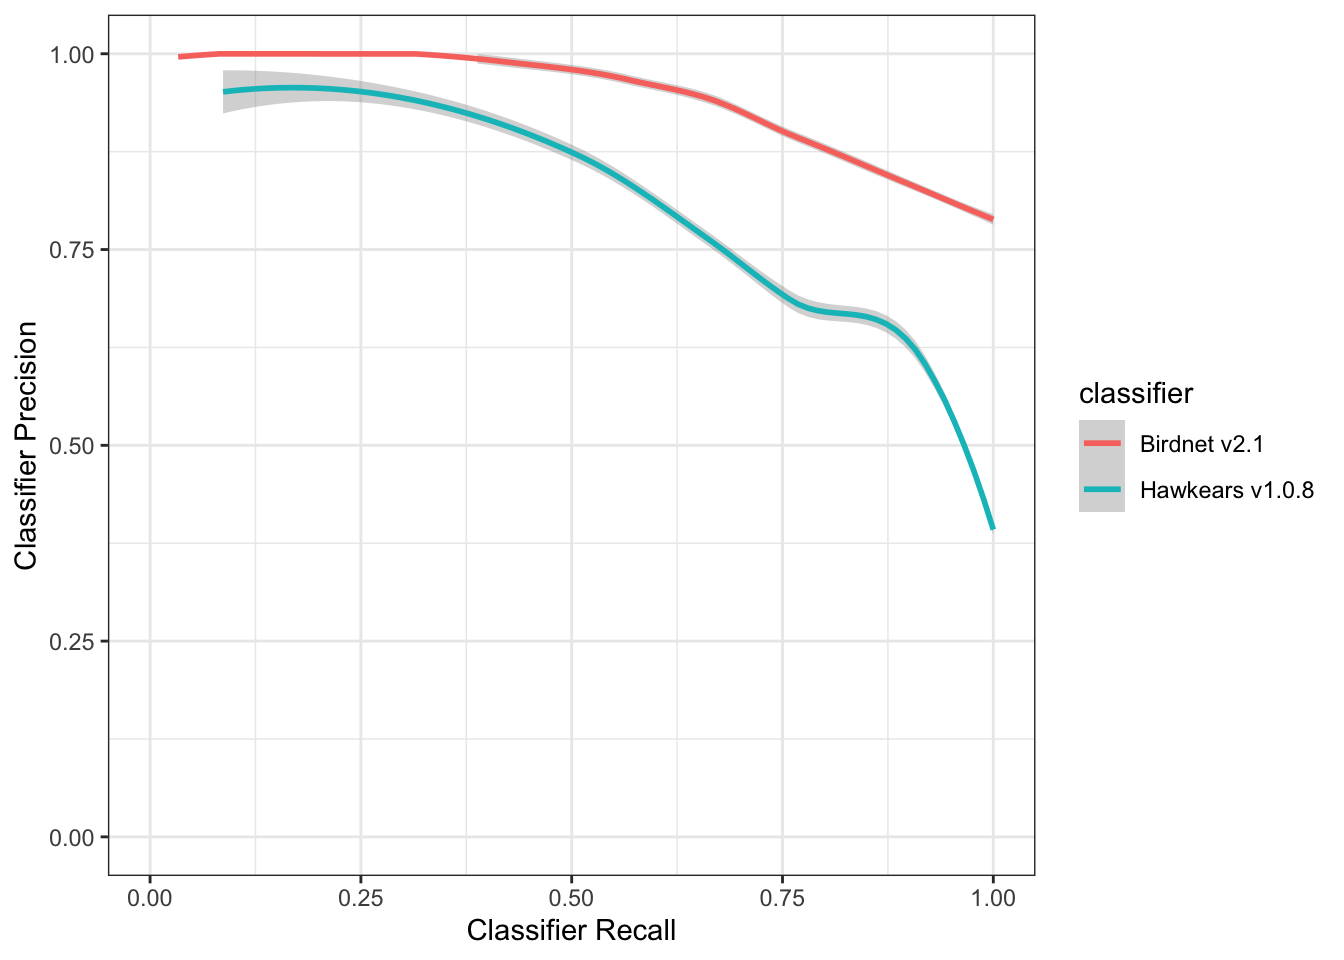
Finally the predicted heatmap of detection at Bowley Pond (Figure 12) and for all Bank swallow monitoring locations (Figure 13). The precision-recall curves demonstrate that BirdNET v2.1 outperforms Hawkears v1.0.8 across most operating points, particularly at moderate to high recall thresholds. BirdNET v2.1 achieves peak precision of approximately 0.53 at a recall of ~0.30, maintaining relatively stable precision (~0.50) across the mid-recall range (0.25–0.60) before declining gradually to ~0.37 at full recall. This plateau suggests the classifier sustains acceptable detection quality even as sensitivity increases. HawkEars v1.0.8 peaks earlier and lower, reaching ~0.45 precision at recall ~0.20, then declines more steeply and consistently. By recall = 1.0, precision drops sharply to ~0.17, roughly half that of BirdNET at the same threshold, indicating a substantially higher false positive rate when the classifier is tuned for maximum sensitivity.
Amphibians
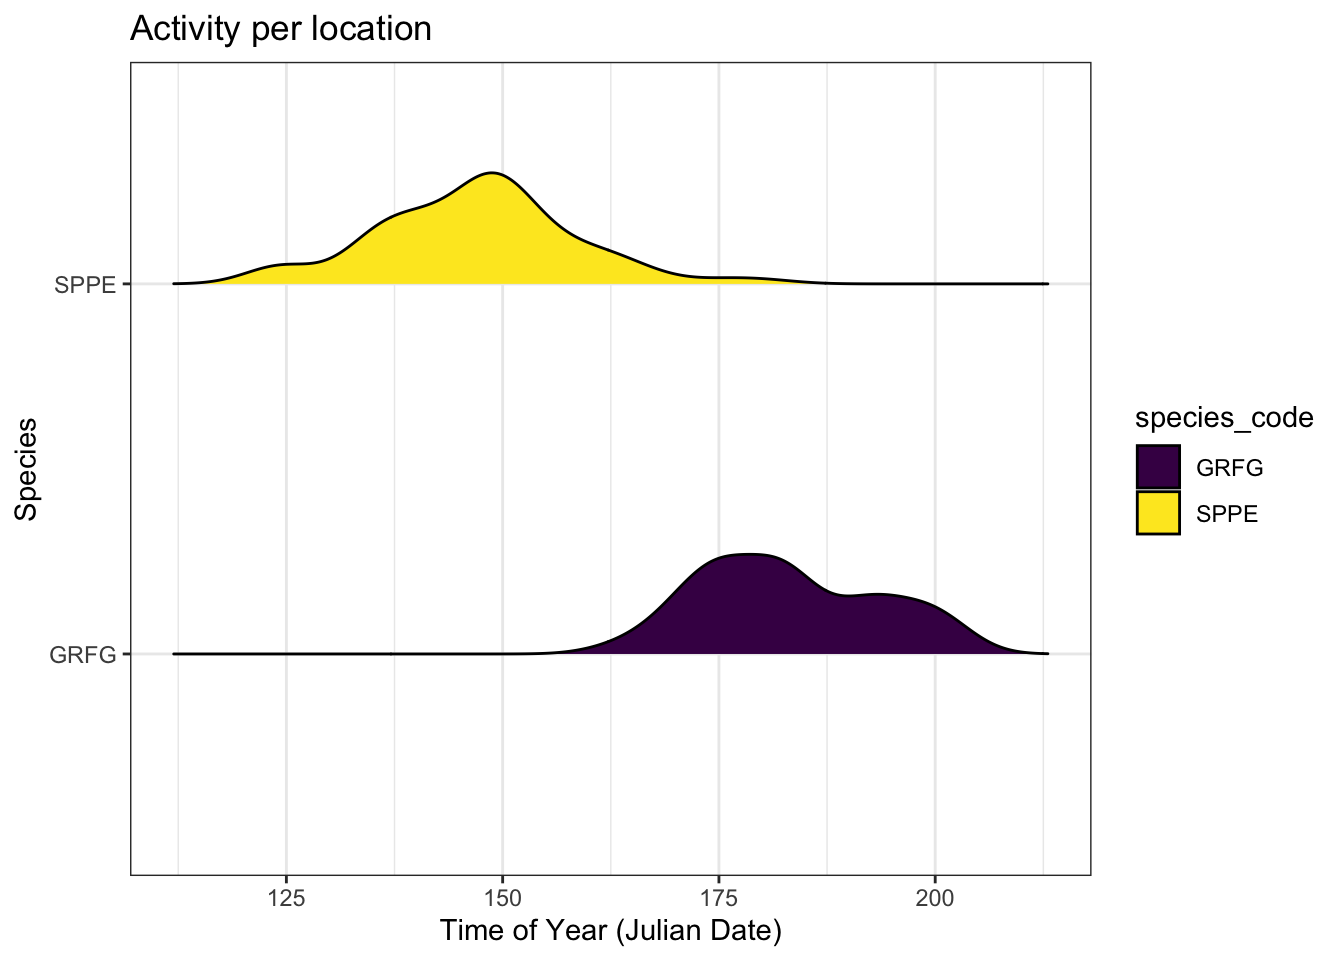
A total of 5 amphibians were detected: SPPE, AMTO, GRFG, BULL, MIFR. A preliminary pattern of amphibian activity can be seen in Figure 15 for Green Frog and Spring Peeper where there were enough detections to generate activity patterns. Spring peeper activity commenced much earlier than Green Frog although seasonal patterns are consistent with the species’ phenology (see Lovett (2013), Ackleh et al. (2010)).
Discussion
Community species responses
Considering the recent (2022) natural disturbance effects seen in the Park, species richness and diversity stayed relatively stable. Individuals nesting in conifer dominant stands likely moved to more suitable habitat outside the park, suggesting the potential utility of metapopulation analysis through passive acoustic monitoring outside of the park via citizen science participation. Further analysis may utilize dynamic occupancy models (Darryl I. MacKenzie et al. (2009)), multi-species multi-season occupancy models (Devarajan, Morelli, and Tenan (2020)), or community shifts (Oksanen et al. (2010)) to describe richness and diversity while accounting for decreases in species that may rely on specific habitat structures within the park. Additional geospatial assets could improve the accuracy of modelling apporaches as well. Nevertheless, this study demostrates the efficacy of autonomous recording units (ARUs) as a powerful tool for monitoring climatic and habitat shifts with a relatively low sample size and area coverage.
Bank swallows
The temporal concentration of predicted calling probability at Clarke’s Pond and Bowley Pond indicates that Bank Swallow activity in Prince Edward Island National Park is strongly seasonal and diel. Detection probability peaked during dusk surveys in late July to early August, aligning with the post-breeding period when adults and fledglings aggregate at pre-migratory roosts before departure (Guide (n.d.), Power et al. (2022)). The rapid decline in detections at Bowley Pond through August 2025 likely reflects local departure rather than methodological bias, suggesting surveys after mid-August may underestimate presence. The 2025 multi-unit deployment at Bowley Pond provides tentative support for improved detection with multiple ARUs. Detections were unevenly distributed, with the eastern unit recording roughly twice as many as other positions, likely due to proximity to a roost. A single-unit design would have missed most detections, indicating spatial heterogeneity in calling activity. However, stronger inference is limited by confounding factors, including site differences, inter-annual variation, sampling effort, and survey timing. Despite this, results are consistent with established evidence that detection probability depends on recorder position (Acevedo and VILLANUEVA-RIVERA (2006), Darras et al. (2018)), and suggest multi-unit arrays may better capture spatial variation at pond roost sites, though controlled experiments are needed for confirmation.
Monitoring recommendations
Avian species within the Park’s forested area demonstrate a non-uniform distribution relative to habitat, the following recommendations for optimizing the efficiency and reliability of the ARU program include:
- Prioritizing monitoring of historical locations, particularly emphasizing repeats at PENP-1-1, PENP-1-2, PENP-3-2, PENP-4-1, PENP-4-3, PENP-4-4 as baselines for evaluating ecological changes over time.
- Adjusting monitoring times to dawn and dusk and extending deployment periods to 4-7 days between May 15 and July 15 to maximize vocalizations during peak activity periods.
- Regular servicing of ARUs, focusing on testing microphone sensitivity degradation to ensure optimal functionality, data reliability, and longevity.
- Continuing high-quality verification of tags to create annotated datasets for building and automating classifiers within WildTrax.
- Data publication WildTrax can further the dissemination of information and participation of others in the park network
References
Abrahms, Briana, Neil H Carter, TJ Clark-Wolf, Kaitlyn M Gaynor, Erik Johansson, Alex McInturff, Anna C Nisi, Kasim Rafiq, and Leigh West. 2023. “Climate Change as a Global Amplifier of Human–Wildlife Conflict.” Nature Climate Change 13 (3): 224–34.
Acevedo, Miguel A, and LUIS J VILLANUEVA-RIVERA. 2006. “From the Field: Using Automated Digital Recording Systems as Effective Tools for the Monitoring of Birds and Amphibians.” Wildlife Society Bulletin 34 (1): 211–14.
Ackleh, Azmy S, Jacoby Carter, Lauren Cole, Tom Nguyen, Jay Monte, and Claire Pettit. 2010. “Measuring and Modeling the Seasonal Changes of an Urban Green Treefrog (Hyla Cinerea) Population.” Ecological Modelling 221 (2): 281–89.
Allan, James R, Oscar Venter, Sean Maxwell, Bastian Bertzky, Kendall Jones, Yichuan Shi, and James EM Watson. 2017. “Recent Increases in Human Pressure and Forest Loss Threaten Many Natural World Heritage Sites.” Biological Conservation 206: 47–55.
Cameron, J., A. Crosby, C. Paszkowski, and E. Bayne. 2020. “Visual Spectrogram Scanning Paired with an Observation–Confirmation Occupancy Model Improves the Efficiency and Accuracy of Bioacoustic Anuran Data.” Canadian Journal of Zoology 98 (11): 733–42. https://doi.org/10.1139/cjz-2020-0103.
Darras, Kevin, Péter Batáry, Brett Furnas, Antonio Celis-Murillo, Steven L Van Wilgenburg, Yeni A Mulyani, and Teja Tscharntke. 2018. “Comparing the Sampling Performance of Sound Recorders Versus Point Counts in Bird Surveys: A Meta-Analysis.” Journal of Applied Ecology 55 (6): 2575–86.
Devarajan, Kadambari, Toni Lyn Morelli, and Simone Tenan. 2020. “Multi-Species Occupancy Models: Review, Roadmap, and Recommendations.” Ecography 43 (11): 1612–24.
Fahrig, Lenore. 2003. “Effects of Habitat Fragmentation on Biodiversity.” Annual Review of Ecology, Evolution, and Systematics 34 (1): 487–515.
Farnsworth, George L, Kenneth H Pollock, James D Nichols, Theodore R Simons, James E Hines, and John R Sauer. 2002. “A Removal Model for Estimating Detection Probabilities from Point-Count Surveys.” The Auk 119 (2): 414–25.
Garland, Laura, Andrew Crosby, Richard Hedley, Stan Boutin, and Erin Bayne. 2020. “Acoustic Vs. Photographic Monitoring of Gray Wolves (Canis lupus): A Methodological Comparison of Two Passive Monitoring Techniques.” Canadian Journal of Zoology 98 (3): 219–28. https://doi.org/10.1139/cjz-2019-0081.
Guide, Montana Field. n.d. “Bank Swallow-Riparia Riparia.”
Hanski, Ilkka. 2011. “Habitat Loss, the Dynamics of Biodiversity, and a Perspective on Conservation.” Ambio 40 (3): 248–55.
Huus, Jan, Kevin G Kelly, Erin M Bayne, and Elly C Knight. 2025. “HawkEars: A Regional, High-Performance Avian Acoustic Classifier.” Ecological Informatics 87: 103122.
Kahl, Stefan, Connor M Wood, Maximilian Eibl, and Holger Klinck. 2021. “BirdNET: A Deep Learning Solution for Avian Diversity Monitoring.” Ecological Informatics 61: 101236.
Knight, Elly C, and Erin M Bayne. 2019. “Classification Threshold and Training Data Affect the Quality and Utility of Focal Species Data Processed with Automated Audio-Recognition Software.” Bioacoustics 28 (6): 539–54.
Lemieux, Christopher J, Thomas J Beechey, Daniel J Scott, and Paul A Gray. 2011. “The State of Climate Change Adaptation in Canada’s Protected Areas Sector.” The Canadian Geographer/Le Géographe Canadien 55 (3): 301–17.
Lovett, Gary M. 2013. “When Do Peepers Peep? Climate and the Date of First Calling in the Spring Peeper (Pseudacris Crucifer) in Southeastern New York State.” Northeastern Naturalist 20 (2): 333–40.
MacKenzie, Darryl I., and Larissa L. Bailey. 2004. “Assessing the Fit of Site-Occupancy Models.” Journal of Agricultural, Biological, and Environmental Statistics 9 (3): 300–318. http://www.jstor.org/stable/1400484.
MacKenzie, Darryl I., James D. Nichols, James E. Hines, Melinda G. Knutson, and Alan B. Franklin. 2003. “ESTIMATING SITE OCCUPANCY, COLONIZATION, AND LOCAL EXTINCTION WHEN a SPECIES IS DETECTED IMPERFECTLY.” Ecology 84 (8): 2200–2207. https://doi.org/https://doi.org/10.1890/02-3090.
MacKenzie, Darryl I, James D Nichols, Gideon B Lachman, Sam Droege, J Andrew Royle, and Catherine A Langtimm. 2002. “Estimating Site Occupancy Rates When Detection Probabilities Are Less Than One.” Ecology 83 (8): 2248–55.
MacKenzie, Darryl I, James D Nichols, Mark E Seamans, and RJ Gutiérrez. 2009. “Modeling Species Occurrence Dynamics with Multiple States and Imperfect Detection.” Ecology 90 (3): 823–35.
MacPhail, Alexander G., Corrina Copp, Erin Bayne, Charles Francis, Michael Packer, Chad Klassen, Kevin Kelly, et al. 2026. “WildTrax: A Platform for the Management, Storage, Processing, Sharing and Discovery of Avian Data.”
Mantyka-pringle, Chrystal S, Tara G Martin, and Jonathan R Rhodes. 2012. “Interactions Between Climate and Habitat Loss Effects on Biodiversity: A Systematic Review and Meta-Analysis.” Global Change Biology 18 (4): 1239–52.
Oksanen, Jari, Frank G Blanchet, Roeland Kindt, Pierre Legendre, Peter R Minchin, Robert B O’Hara, Gavin L Simpson, et al. 2010. “Canonical Analysis of Principal Coordinates: A Useful Method of Constrained Ordination for Ecology.” Ecology 92 (3): 597–611. https://doi.org/10.1890/10-0340.1.
Pijanowski, Bryan C., Luis J. Villanueva-Rivera, Sarah L. Dumyahn, Almo Farina, Bernie L. Krause, Brian M. Napoletano, Stuart H. Gage, and Nadia Pieretti. 2011. “Soundscape Ecology: The Science of Sound in the Landscape.” BioScience 61 (3): 203–16. https://doi.org/10.1525/bio.2011.61.3.6.
Power, Tyler J, Hailey Paynter, Marina Silva-Opps, and Pedro A Quijón. 2022. “The Coastal Breeding Habitat of Bank Swallows (Riparia Riparia) in an Atlantic Canada National Park: Assessing Habitat Use in Relation to Availability.” Canadian Journal of Zoology 100 (10): 681–86.
Sattar, Q, ME Maqbool, R Ehsan, S Akhtar, Q Sattar, ME Maqbool, R Ehsan, and S Akhtar. 2021. “Review on Climate Change and Its Effect on Wildlife and Ecosystem.” Open J Environ Biol 6 (1): 008–14.
Shannon, Claude Elwood. 1948. “A Mathematical Theory of Communication.” The Bell System Technical Journal 27 (3): 379–423.
Shonfield, Julia, and Erin M Bayne. 2017. “Autonomous Recording Units in Avian Ecological Research: Current Use and Future Applications.” Avian Conservation & Ecology 12 (1).
Shonfield, Julia, Sarah Heemskerk, and Erin M Bayne. 2018. “Utility of Automated Species Recognition for Acoustic Monitoring of Owls.” Journal of Raptor Research 52 (1): 42–55.
Sólymos, Péter, Steven M. Matsuoka, Steven G. Cumming, Diana Stralberg, Patricia Fontaine, Fiona K. A. Schmiegelow, Samantha J. Song, and Erin M. Bayne. 2018. “Evaluating time-removal models for estimating availability of boreal birds during point count surveys: Sample size requirements and model complexity.” The Condor 120 (4): 765–86. https://doi.org/10.1650/CONDOR-18-32.1.
Sugai, Larissa Sayuri Moreira, Thiago Sanna Freire Silva, Jr Ribeiro José Wagner, and Diego Llusia. 2018. “Terrestrial Passive Acoustic Monitoring: Review and Perspectives.” BioScience 69 (1): 15–25. https://doi.org/10.1093/biosci/biy147.
Turgeon, Patrick, Steven L. Van Wilgenburg, and Kiel L. Drake. 2017. “Microphone Variability and Degradation: Implications for Monitoring Programs Employing Autonomous Recording Units.” Avian Conservation and Ecology 12. https://api.semanticscholar.org/CorpusID:89959184.
Ware, Lena, C. Lisa Mahon, Logan McLeod, and Jean-François Jetté. 2023. “Artificial Intelligence (BirdNET) Supplements Manual Methods to Maximize Bird Species Richness from Acoustic Data Sets Generated from Regional Monitoring.” Canadian Journal of Zoology 101 (12): 1031–51. https://doi.org/10.1139/cjz-2023-0044.